Bitcoin (BTC/USD) Trade Bargains at $30,000
Estimated Reading Time: 3 minutes
Don’t invest unless you’re prepared to lose all the money you invest. This is a high-risk investment and you are unlikely to be protected if something goes wrong. Take 2 minutes to learn more

Free Crypto Signals Channel
Bitcoin Price Prediction – May 22
The BTC/USD trade bargains at a $30,000 trading line for several business sessions. Smaller-ups and smaller-downs have appeared in the $30,275 and $29,251, showing the pace at which the market pushes with a 2.38% positive.
BTC/USD Market
Key Levels
Resistance levels: $32,500, $35,000, $37,500
Support levels: $27,500, $25,000, $22,500
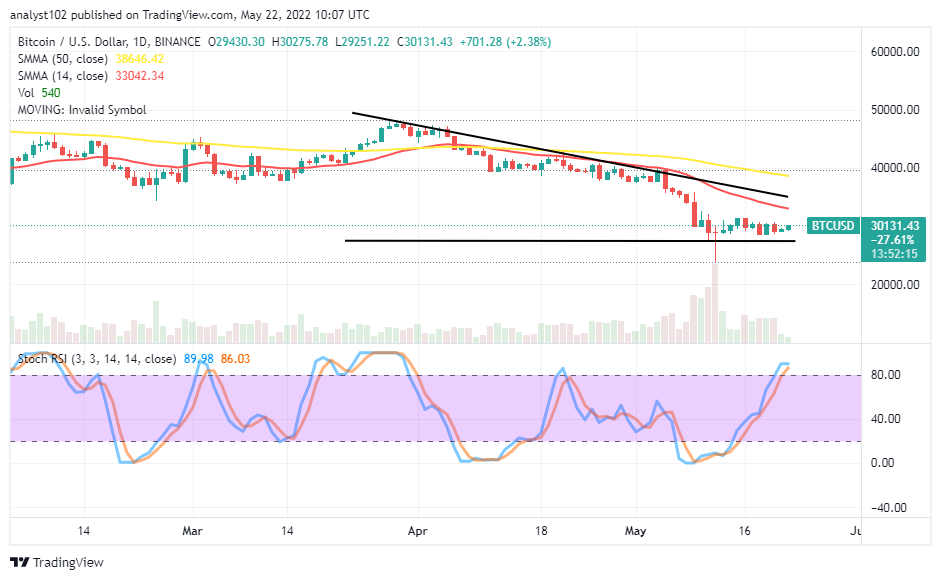
BTC/USD – Daily Chart
The daily chart reveals the BTC/USD trade bargains at the $30,000 trading level. The 50-day SMA indicator is above the 14-day SMA indicator. The bearish trend line drew southward closely around the downward trending path of the smaller SMA, giving a backing strength to it. The Stochastic Oscillators have slightly moved into the overbought region. And they are seemingly trying to close the lines within it, signifying the possibility of the market experiencing a pause in the wake of getting further upward momentums.
Will the BTC/USD market’s current trading situation run in a downing direction soon or not?
The BTC/USD market’s current trading situation is likely to run more into the downing direction soon as there have variant lower lows in place of having lower highs. Presently, the crypto-economic trade bargains at $30,000The $27,500 support level serves as the critical baseline against the near subsequent pushes to the downside. Long-position takers will have to settle for decent buying entry orders while price tends diving through some lower support levels, giving back signs of a rebounding alongside the course.
On the downside of the technical analysis, it all seems, getting set for rejections around the trend line of the 14-day SMA to allow the BTC/USD market bears to get the control at the expense of bulls’ weaknesses. Price is to either swing into a rallying motion or make a sudden breakout against the resistant barrier point around the $32,500 to invalidate the chance of short-position takers to make a come-back.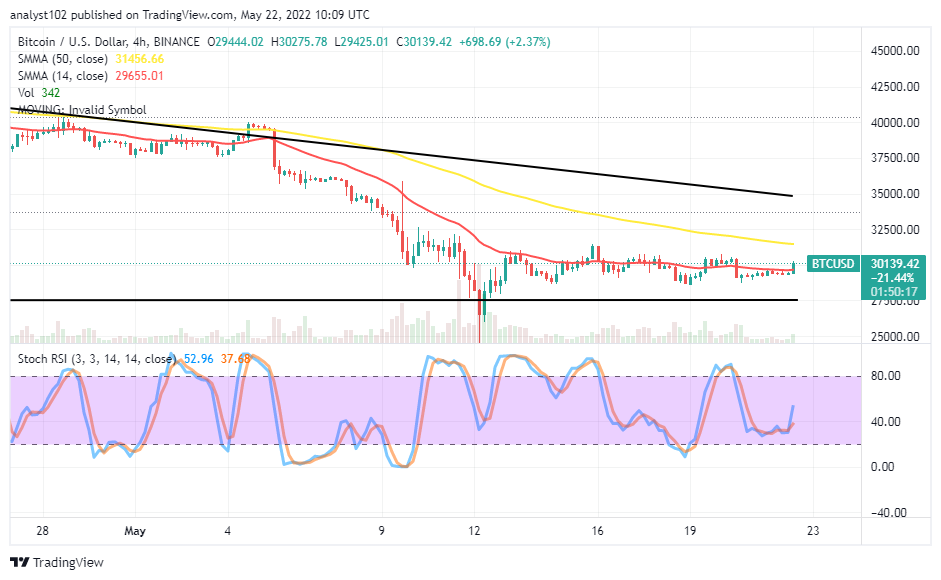
BTC/USD 4-hour Chart
The BTC/USD medium-term chart exhibits the crypto-economic trade bargains at $30,000. Different candlesticks have featured around the smaller SMA. The 50-day SMA indicator is above the 14-day SMA indicator. A bullish candlestick is in the making from the positioning of the 14-day SMA to indicate a buying motion is on course as the Stochastic Oscillators have crossed northbound from within the 40 and 20 range points. And they are still pointing toward the north side to specify the US currency is relaxing in its purchasing power.
Note: Cryptosignals.org is not a financial advisor. Do your research before investing your funds in any financial asset or presented product or event. We are not responsible for your investing results.
“Lucky is up more than 50% today but still more than 430% from All Time Highs!
The opportunity to bank BIG is now!
You can purchase Lucky Block here. Buy LBlock: