Bitcoin (BTC/USD) Trade Poises for Price Action
Estimated Reading Time: 3 minutes
Don’t invest unless you’re prepared to lose all the money you invest. This is a high-risk investment and you are unlikely to be protected if something goes wrong. Take 2 minutes to learn more
Bitcoin Price Prediction – August 15
There has now been a trace in the BTC/USD operation that the crypto trade poises for price action to determine a definite direction of the trading activities. As of analyzing the market, price records a smaller percentage rate of -2.02, trading around the level at $46,672.
BTC/USD Market
Key Levels:
Resistance levels: $50,000, $52,500, $55,000
Support levels: $42,500, $40,000, $37,500
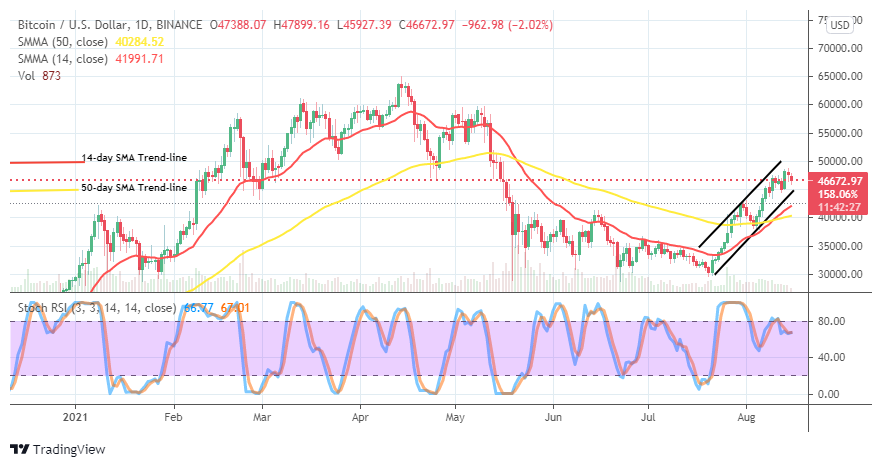
BTC/USD – Daily Chart
The BTC/USD daily chart depicts that the crypto trade poises for price action as there has been a kind of correction movement below the resistance value of $50,000. The 14-day SMA trend-line is above the 50-day SMA trend-line, pointing northward below the lower bullish channel trend-line drew. The crypto market still keeps within the bullish channel trend lines. The Stochastic Oscillators are between ranges of 80 and 40, attempting to close the lines. That signifies that the market may soon brace up for a return of upswings.Do some ups still releasable in the BTC/USD transaction as the trade poises for price action?
A kind of retracement appears in the market operation between Bitcoin and the US Dollar as the crypto trade poises for price action around the lower line. The crypto’s northward journey may not have ended, especially if the price fails to break down and keep below the support line at $45,000. A pull-down will be necessary for bulls to reposition their stance in the market trading space.
On the downside, continual testing of around a higher point at $50,000 may more often than none allow the BTC/USD market bears to get a decent sell signal afterward. Nevertheless, a fearful breakout at that point will nullify the getting of a decent sell position in time. It is unlikely that any re-occurrence of falling force will get the pace beyond the immediate support line at $42,500.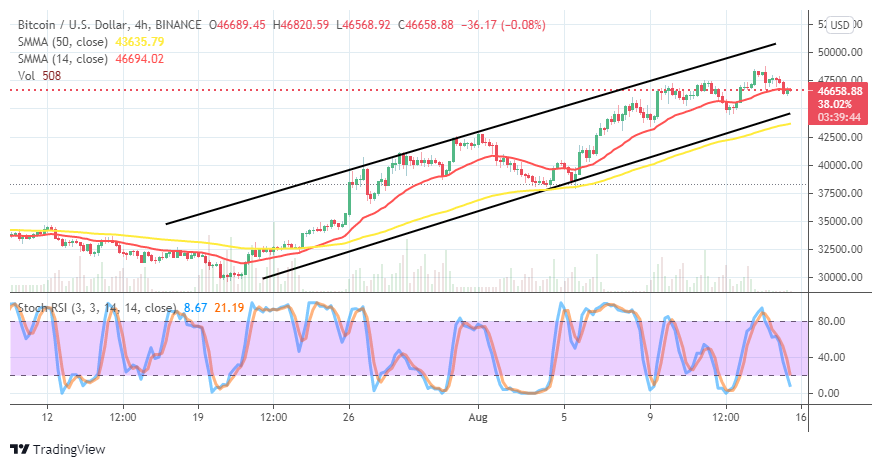
BTC/USD 4-hour Chart
The retracement movement is more distinctively observed on the BTC/USD medium-term chart as trade poises for price action. The Stochastic Oscillators have freshly dipped into the oversold region, seemingly attempting to get the lines crossed back northbound. The bullish channel trend lines intently drew to showcase the northward path that price maintains. The 14-day SMA indicator is in the channel lines over the 50-day SMA indicator. A bullish candlestick seems in the making to portend a possible upside move in the near time.
Note: Cryptosignals.org is not a financial advisor. Do your research before investing your funds in any financial asset or presented product or event. We are not responsible for your investing results.
You can purchase crypto coins here. Buy Tokens