Bitcoin (BTC/USD) Trade Witnesses Severe Swing Lows
Estimated Reading Time: 3 minutes
Don’t invest unless you’re prepared to lose all the money you invest. This is a high-risk investment and you are unlikely to be protected if something goes wrong. Take 2 minutes to learn more

Free Crypto Signals Channel
Bitcoin Price Prediction – May 11
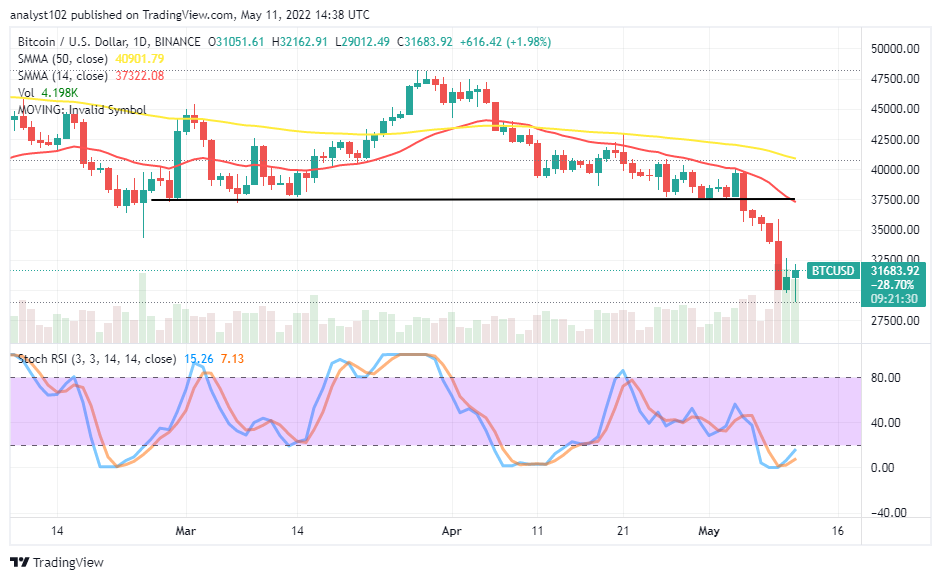
The BTC/USD trade witnesses severe swing lows as the crypto-economic price elongates transactions, passing through lower support points beneath the $32,500 retardation line. The market’s high and low trading value lines currently stand between $32,162 and $29,012, maintaining a positive percentage of 1.98.
BTC/USD Market
Key Levels:
Resistance levels: $32,500, $35,000, $37,500
Support levels: $27,500, $25,000, $22,500
BTC/USD – Daily Chart
The BTC/USD daily chart reveals the crypto-economic trade witnesses severe swing lows, trading underneath the resistance level at $32,500. The 14-day SMA indicator has bent southward to lightly touch past the $37,500 resistance level where the horizontal line is drawn and, they are underneath the 50-day SMA indicator. The Stochastic Oscillators are in the oversold region, trying to cross their lines northbound closely to the range of 20 to indicate that the current aggressive depression is on the verge of completion.
Will the BTC/USD market bulls lose more momentum severely beyond $30,000?
There has been an indication suggesting that an extreme oversold condition has been reached as the crypto-economic trade witnesses severe swing lows. Long-position takers should be wary of multiple opening orders to avoid unnecessary loss of positions to panic sell-offs. Better buying opportunity signs may crop up around the $30,000 if bears tend to relax their efforts around that trading capacity.
On the downside of the technical analysis, the BTC/USD market’s falling forces have to hold firmly against the swinging of price past the $32,500 resistance trading line in the close-by sessions. If the value line has to witness several rejections, then, more aggressive downward forces will resurface to possibly dip down more to lower support around the $27,500.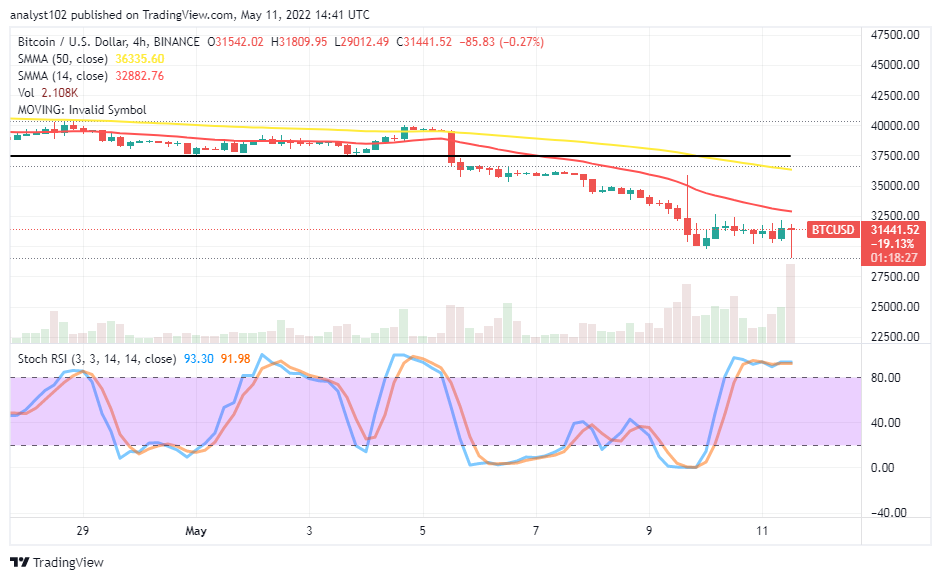
BTC/USD 4-hour Chart
The BTC/USD 4-hour chart reveals the crypto-economic trade witnesses severe swing lows underneath the trend line of the smaller SMA. Both the SMA trend lines are below the horizontal line drawn at $37,500. The 14-day SMA is under the 50-day SMA and, they are over the current trading spot. The Stochastic Oscillators are in the overbought region, with conjoint lines, moving in a consolidation manner. Some lower lows have been featuring beneath the $32,500 resistance level to signify that bears may force down the market furthermore in the following operations
Note: Cryptosignals.org is not a financial advisor. Do your research before investing your funds in any financial asset or presented product or event. We are not responsible for your investing results.
You can purchase Lucky Block here. Buy LBlock: