Bitcoin Price Prediction: BTC Slumps After Touching $28,751 Resistance
Estimated Reading Time: 3 minutes
Don’t invest unless you’re prepared to lose all the money you invest. This is a high-risk investment and you are unlikely to be protected if something goes wrong. Take 2 minutes to learn more
The Bitcoin price prediction shows that BTC rises in the early hours of today, but got rejected as the market slumped.
BTC/USD Long-term Trend: Ranging (Daily Chart)
Key levels:
Resistance Levels: $31,000, $32,000, $33,000
Support Levels: $25,000, $24,000, $23,000
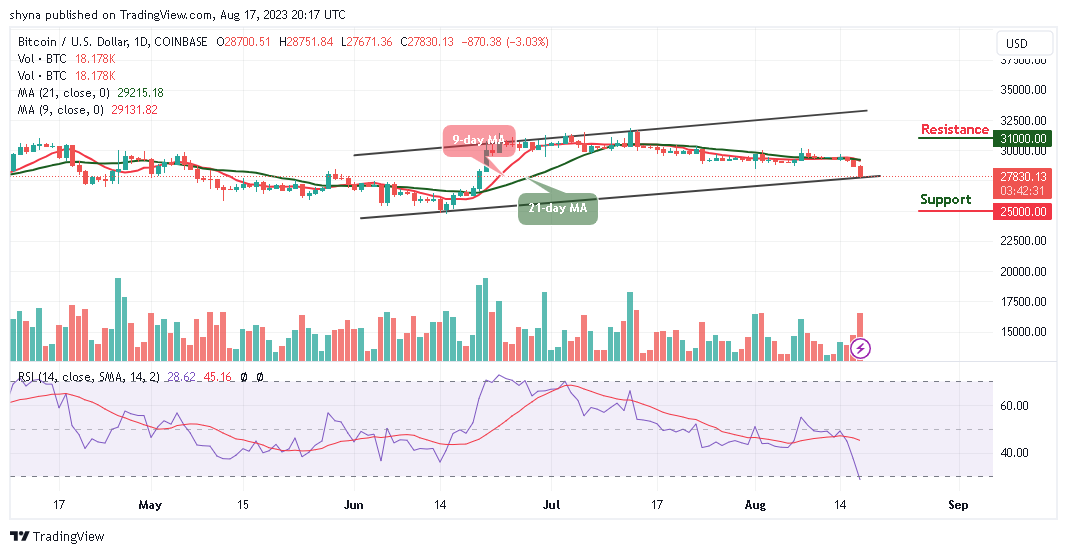
BTC/USD may continue to follow the bearish movement if the bears force the king coin to bow down to fresh losses. Presently, the Bitcoin price is changing hands at $27,830 after adjusting from the resistance level of $28,751, which is an intraday high.
Bitcoin Price Prediction: Bitcoin (BTC) Bears May Surface Again
The Bitcoin price reveals that the market price may continue with the downtrend as the bullish movement is not visible now. Meanwhile, the technical indicator Relative Strength Index (14) may confirm the bearish movement if the signal line slides into the oversold region.
Meanwhile, the bulls are trying to push the Bitcoin price back toward the 9-day and 21-day moving averages. But, any bearish movement below the lower boundary of the channel may cause the coin to reach the critical supports at $25,000, $24,000, and $23,000. On the positive side, if the king coin heads toward the upper boundary of the channel; it could hit the nearest resistance levels at $31,000, $32,000, and $33,000 respectively.
BTC/USD Medium-term Trend: Bearish (4H Chart)
According to the 4-hour chart, the Bitcoin price remains below the 9-day and 21-day moving averages as the bears continue to dominate the market. On the contrary, the bulls are trying to defend the $27,500 support. If not, the support level of $27,000 and below may come into play should the king coin focuses on the downward movement.
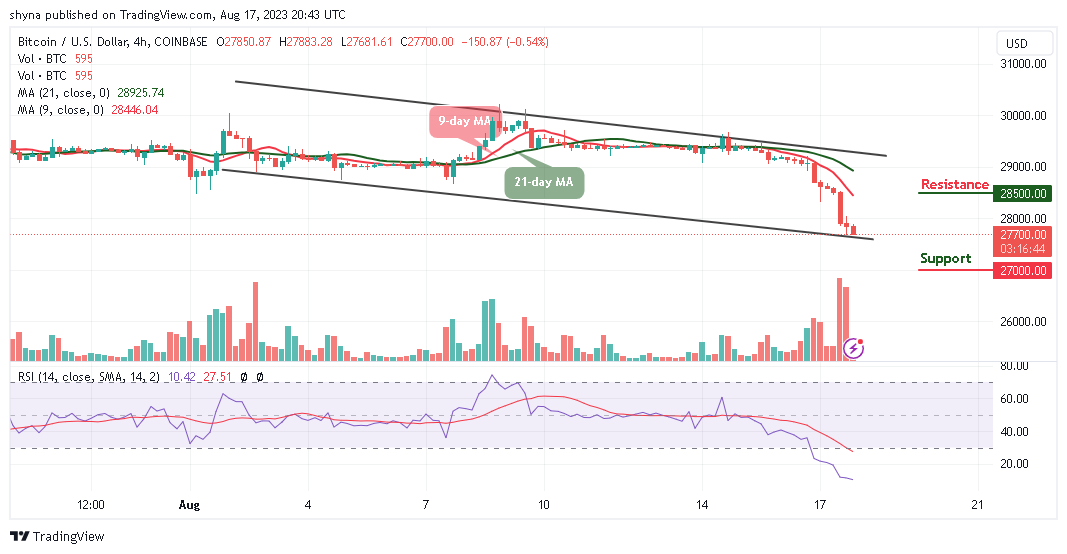
Moreover, buyers may need to hold the current market value at $27,700, once this is done, traders may expect a movement above the 9-day moving average, and this could take the Bitcoin price to the resistance level of $28,500 and above. Meanwhile, the technical indicator Relative Strength Index (14) is seen within the oversold region, suggesting a continuous bearish movement.
You can purchase Bitcoin here. Buy BTC