Bitcoin Price Prediction: BTC/USD Eyes $40k Resistance Level
Estimated Reading Time: 3 minutes
Don’t invest unless you’re prepared to lose all the money you invest. This is a high-risk investment and you are unlikely to be protected if something goes wrong. Take 2 minutes to learn more
Bitcoin Price Prediction – November 28
The Bitcoin price prediction shows that BTC bulls’ comeback is likely to send the price toward the resistance level of $40,000.
BTC/USD Long-term Trend: Ranging (Daily Chart)
Key levels:
Resistance Levels: $42,000, $44,000, $46,000
Support Levels: $33,000, $31,000, $29,000
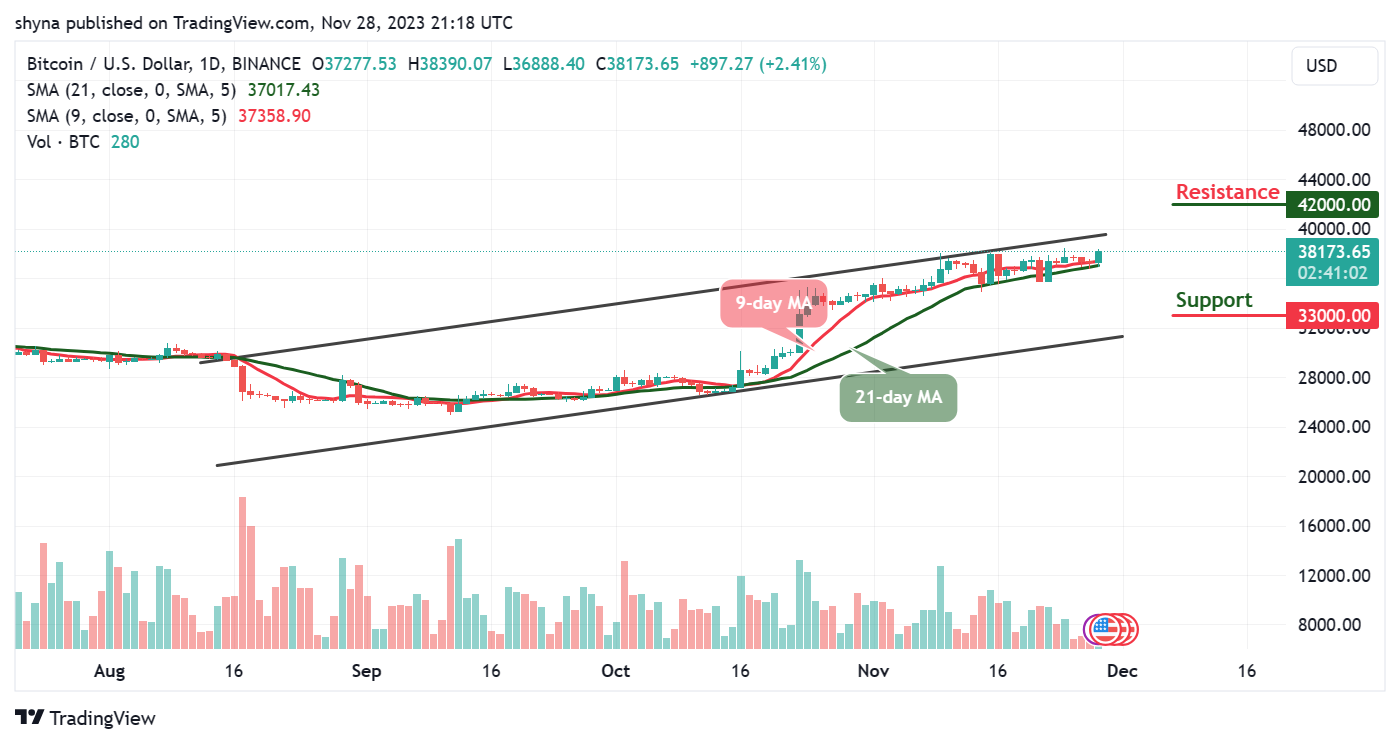
The daily chart shows that BTC/USD is trading above the 9-day and 21-day moving averages following a bearish correction. Today, the European session is characterized by a renewed upward trend whereby BTC/USD touches the daily high at $38,390. Moreover, the Bitcoin price is currently hovering at 2.41% higher on the day as the king coin moves toward the upper boundary of the channel.
Bitcoin Price Prediction: BTC Needs to Move Above $39,000
Looking at the daily chart, the Bitcoin price is yet to trade below the support level of $36,000. Therefore, the first digital asset is now hovering above the moving averages. On a bullish note, the bulls may increase the buying pressure, which could suggest that the Bitcoin price will cross above the channel.
However, a strong bullish movement toward the upside may take the price to the resistance levels of $42,000, $44,000, and $46,000. Moreover, if the market makes a quick turn to the south, BTC/USD may likely cross below the support level of $37,000, and should this support fail to contain the sell-off, traders may see a further drop to the support levels of $33,000, $31,000, and critically $29,000.
BTC/USD Medium-term Trend: Ranging (4H Chart)
Following the 4-hour chart, Bitcoin (BTC) is now trading at around $38,162. Although the Bitcoin price has not yet closed above $39,000, it’s still in the loop of making a reversal. However, the Bitcoin price hovers above the 9-day and 21-day moving averages and may take time to persistently trade toward the channel.
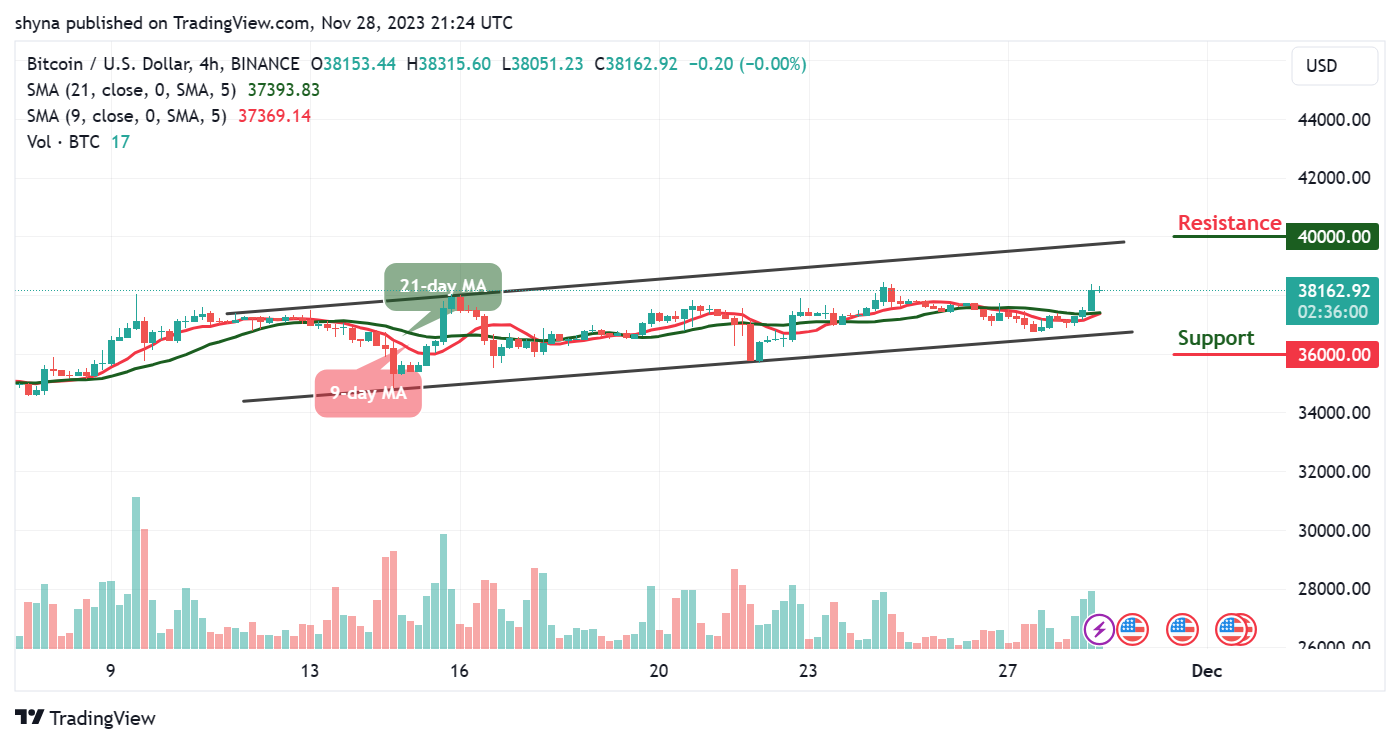
At the moment, BTC/USD is currently moving sideways as the 9-day MA moves to cross above the 21-day MA, the upward movement may likely cause the coin to hit the nearest resistance level at $40,000 and above while the immediate support lies at $36,000 and below.
You can purchase Bitcoin here. Buy BTC