Bitcoin Price Prediction: BTC/USD Faces Fresh Support At $29,000
Don’t invest unless you’re prepared to lose all the money you invest. This is a high-risk investment and you are unlikely to be protected if something goes wrong. Take 2 minutes to learn more
Bitcoin Price Prediction – July 17
The Bitcoin price prediction shows BTC sliding toward the downside as the cryptocurrency touches the $29,787 low.
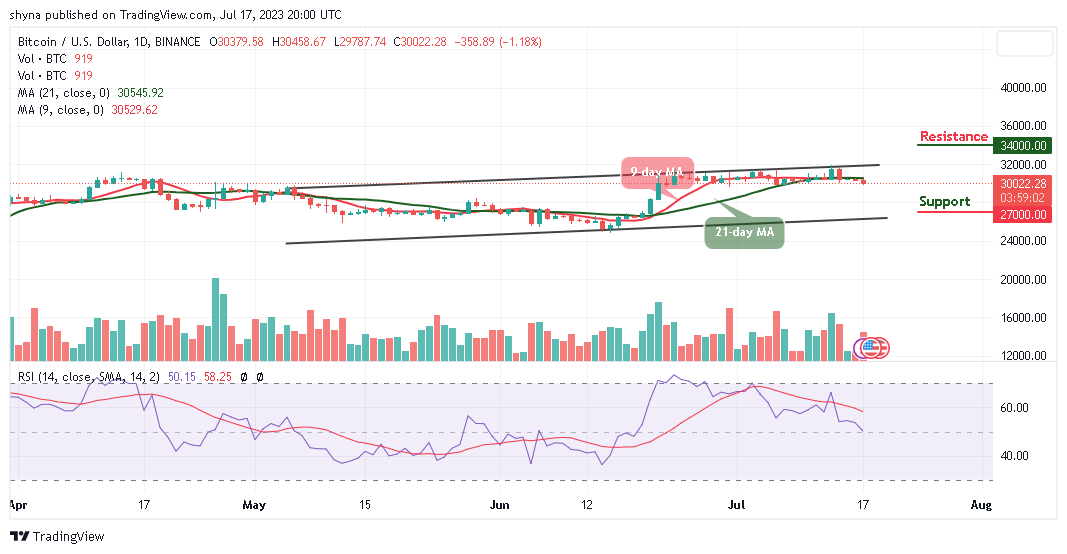
BTC/USD Long-term Trend: Ranging (Daily Chart)
Key levels:
Resistance Levels: $34,000, $35,000, $36,000
Support Levels: $27,000, $26,000, $25,000
BTC/USD is seen dropping with another loss of 1.18% today as the cryptocurrency falls beneath the $30,000 support level to reach the daily low at $29,787. However, the daily chart reveals that $29,000 is a very important area as it is expected to provide strong support for the coin.
Bitcoin Price Prediction: Bitcoin Price May Cross Below $29k
The Bitcoin price begins to slide below the 9-day and 21-day moving averages at support provided by the trend line of the channel. A breakdown below this trend line could cause the Bitcoin price to create a new low below the $29,000 level. However, a bearish slide toward the lower boundary of the channel could be detrimental to Bitcoin as it could lead the first digital asset toward the supports at $27,000, $26,000, and $25,000.
Moreover, if the buyers can rebound from the current support level of $30,022, the first level of resistance could lie at $31,000. This may likely follow by the potential resistance at $34,000, $35,000, and $36,000 levels. Therefore, if the coin can break above these levels, then the market may be on the verge of turning bullish in the long term. Presently, the Relative Strength Index (14) is likely to cross below the 50-level, indicating that more bearish signals might come to play.
BTC/USD Medium-term Trend: Ranging (4H Chart)
As revealed by the 4-hour chart, the Bitcoin price is seen hovering at $30,069 as the coin trades around the lower boundary of the channel with sellers forcing its price down to the low of $29,900. However, if the bulls decide to push the market price back above the 9-day and 21-day moving averages, the coin may likely hit the resistance at $31,500 and above.
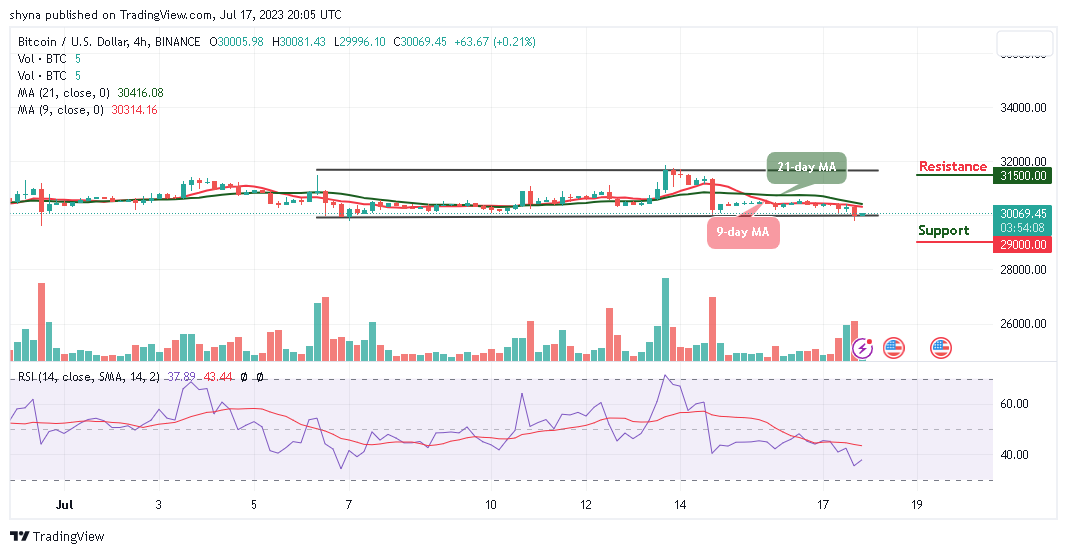
Nevertheless, it now appears that the cryptocurrency is at risk of seeing further downside in the near term, as the multiple attempts to shatter its $29,500 support seem to indicate that bears are building momentum. As the Relative Strength Index (14) remains below the 40-level, the king coin may locate critical support at $29,000 and below.
You can purchase Bitcoin here. Buy BTC