Bitcoin Price Prediction: BTC/USD Fails to Take $36,000 Resistance
Estimated Reading Time: 2 minutes
Don’t invest unless you’re prepared to lose all the money you invest. This is a high-risk investment and you are unlikely to be protected if something goes wrong. Take 2 minutes to learn more
Bitcoin Price Prediction – November 5
The Bitcoin price prediction indicates bearish momentum as the coin fails to cross above the upper boundary of the channel.
BTC/USD Long-term Trend: Ranging (Daily Chart)
Key levels:
Resistance Levels: $39,000, $40,000, $41,000
Support Levels: $31,000, $30,000, $29,000
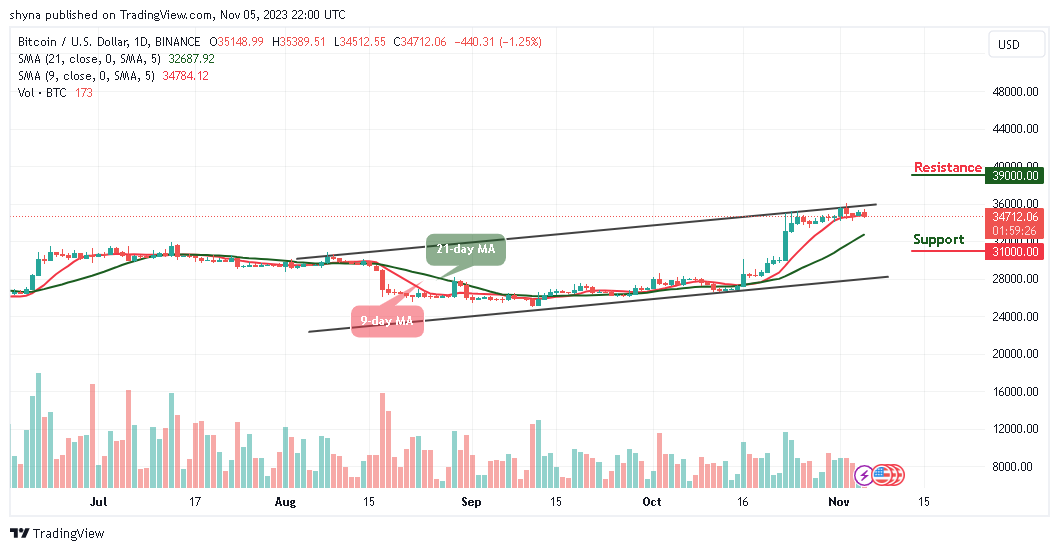
At the time of writing, BTC/USD is hovering around $34,712 level. However, the king coin has not been able to reclaim the resistance level of $36,000 as the coin consolidates above the 9-day and 21-day moving averages. However, the Bitcoin price may continue to follow the sideways movement as the formation of a bearish movement is likely to play out.
Bitcoin Price Prediction: BTC Price May Consolidate to the Downside
As the Bitcoin price moves to cross below the 9-day moving average, BTC/USD is likely to head to the downside. On the contrary, the king coin may cross above the upper boundary of the channel, if the bulls step back into the market and increase the buying pressure.
Moreover, a sustainable move above the upper boundary of the channel could then locate the resistance level of $36,000, which may allow for an extended recovery toward the potential resistance levels at $39,000, $40,000, and $41,000. Meanwhile, an increase in selling pressure may bring the Bitcoin price toward the supports at $31,000, $30,000, and $29,000.
BTC/USD Medium-term Trend: Ranging (4H Chart)
Looking at the 4-hour chart, the Bitcoin price is trading below the 9-day and 21-day moving averages. However, if the price breaks to the upside, heading toward the upper boundary of the channel ay locate the higher resistance level at$37,000 and above.
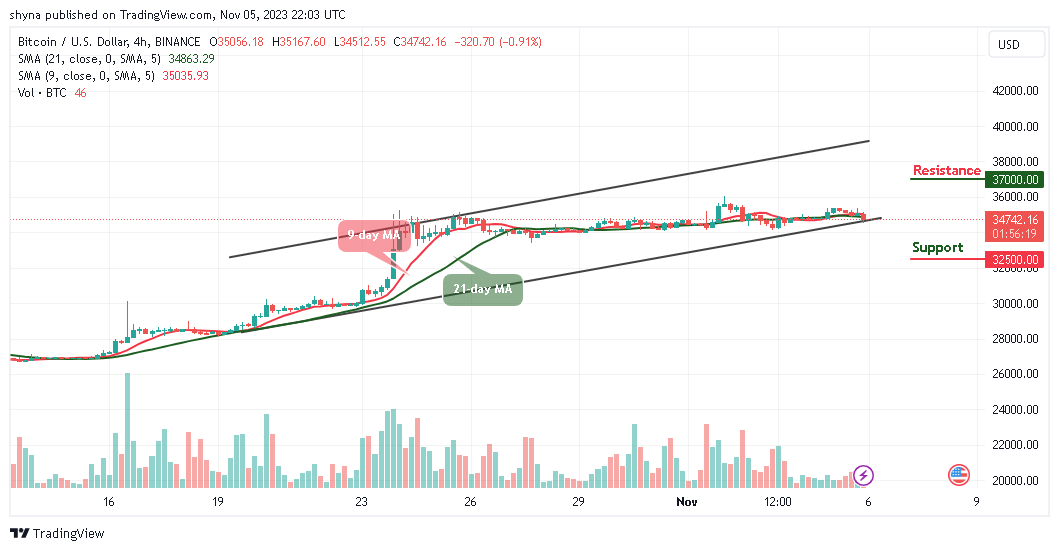
Nevertheless, if the bearish movement increases in the market, BTC/USD may cross below the lower boundary of the channel to locate the nearest support at $33,000. However, any further bearish movement may hit the support level of $32,500 and below.
You can purchase Bitcoin here. Buy BTC


