Polygon (POL) Price Prediction: POL Sustains Above the $0.7000 Mark
Estimated Reading Time: 3 minutes
Don’t invest unless you’re prepared to lose all the money you invest. This is a high-risk investment and you are unlikely to be protected if something goes wrong. Take 2 minutes to learn more
Polygon (POL) Price Prediction: May 19
The Polygon token has gathered some upside momentum, breaking through the $0.7000 mark. However, the market seems to have encountered some headwinds after breaking that key resistance.
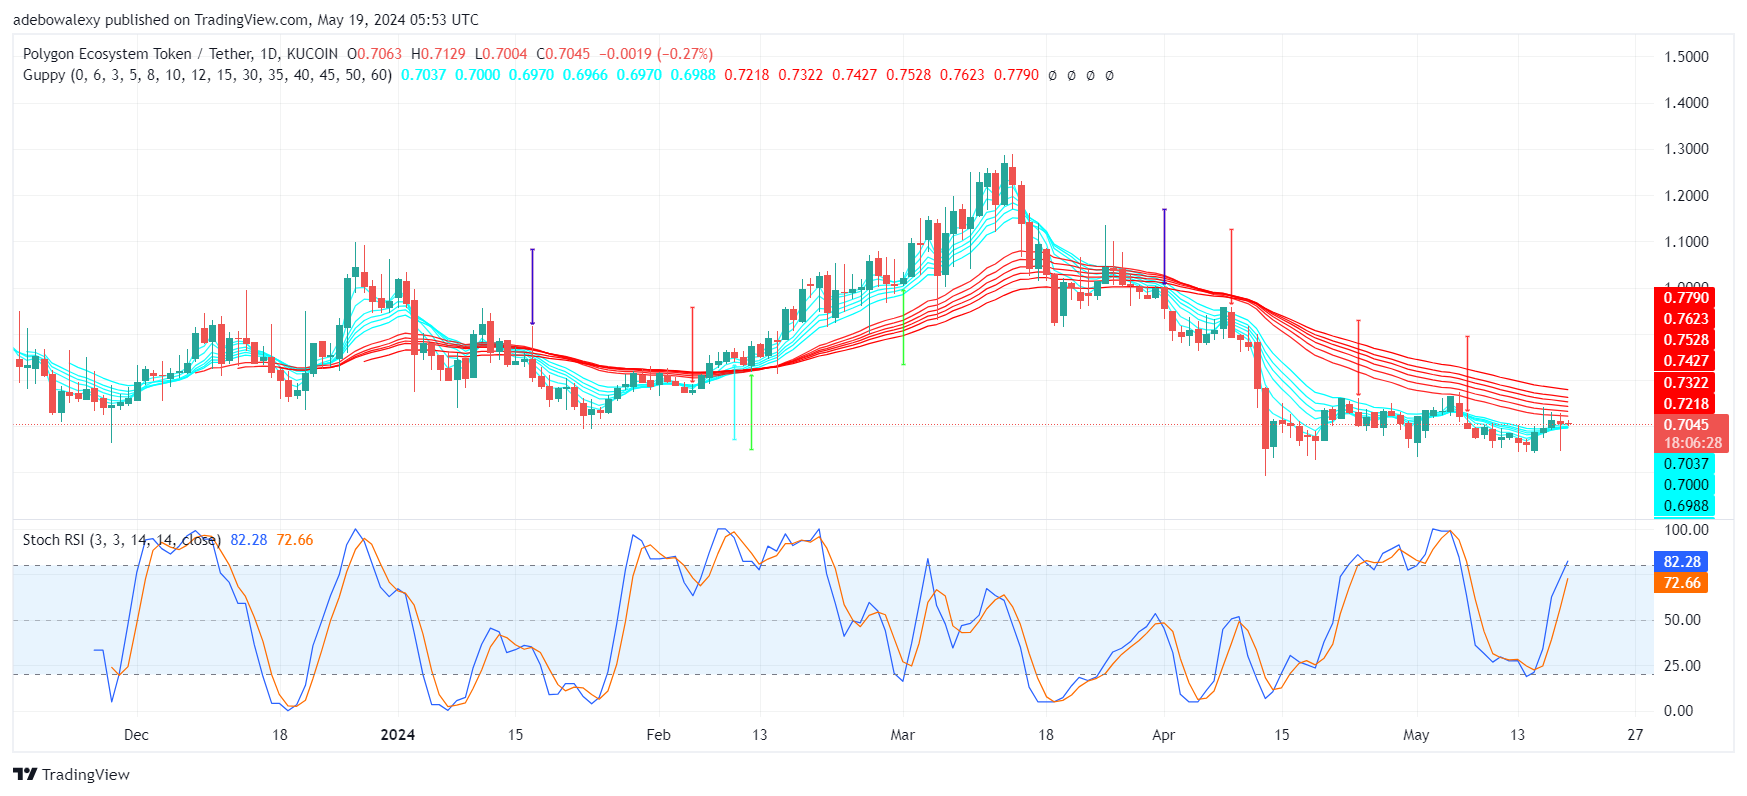
POL/USDT Long-term Trend: Bearish (Daily Chart)
Key Levels:
Resistance Levels: $0.8000, $0.9000, and $1.000
Support Levels: $0.7000, $0.6000, and $0.5000
Price action in the Polygon market has broken the resistance level at the $0.7000 mark, as noted earlier. Meanwhile, the past two sessions have shown only the minutest downward correction, as the token keeps trading above the $0.7000 price level. The last price candle on this chart shows that market forces are battling at this point. Nevertheless, the token continues trading above the green Guppy Multiple Moving Average (GMMA) curves. The Stochastic Relative Strength Index (SRSI) indicator is pointed upwards into the overbought region despite the recent rejection.
Daily Chart
Polygon Price Prediction: Will Bulls Protect the $0.7000 Support?
Price action in the Polygon daily market can be seen trying to retain the acquired support at the $0.7000 mark. This is happening even though price movement has been facing sustained pressure since the previous session. This reveals that upside forces are putting up a fight at this point.
The lines of the SRSI indicator remain extended toward the overbought region. However, this seems a bit exaggerated, as it appears too elongated. This shows that downward forces are trying to wear out upside momentum at this point. Nevertheless, should upside forces win the tussle, prices may march further upwards toward the $0.8500 mark.
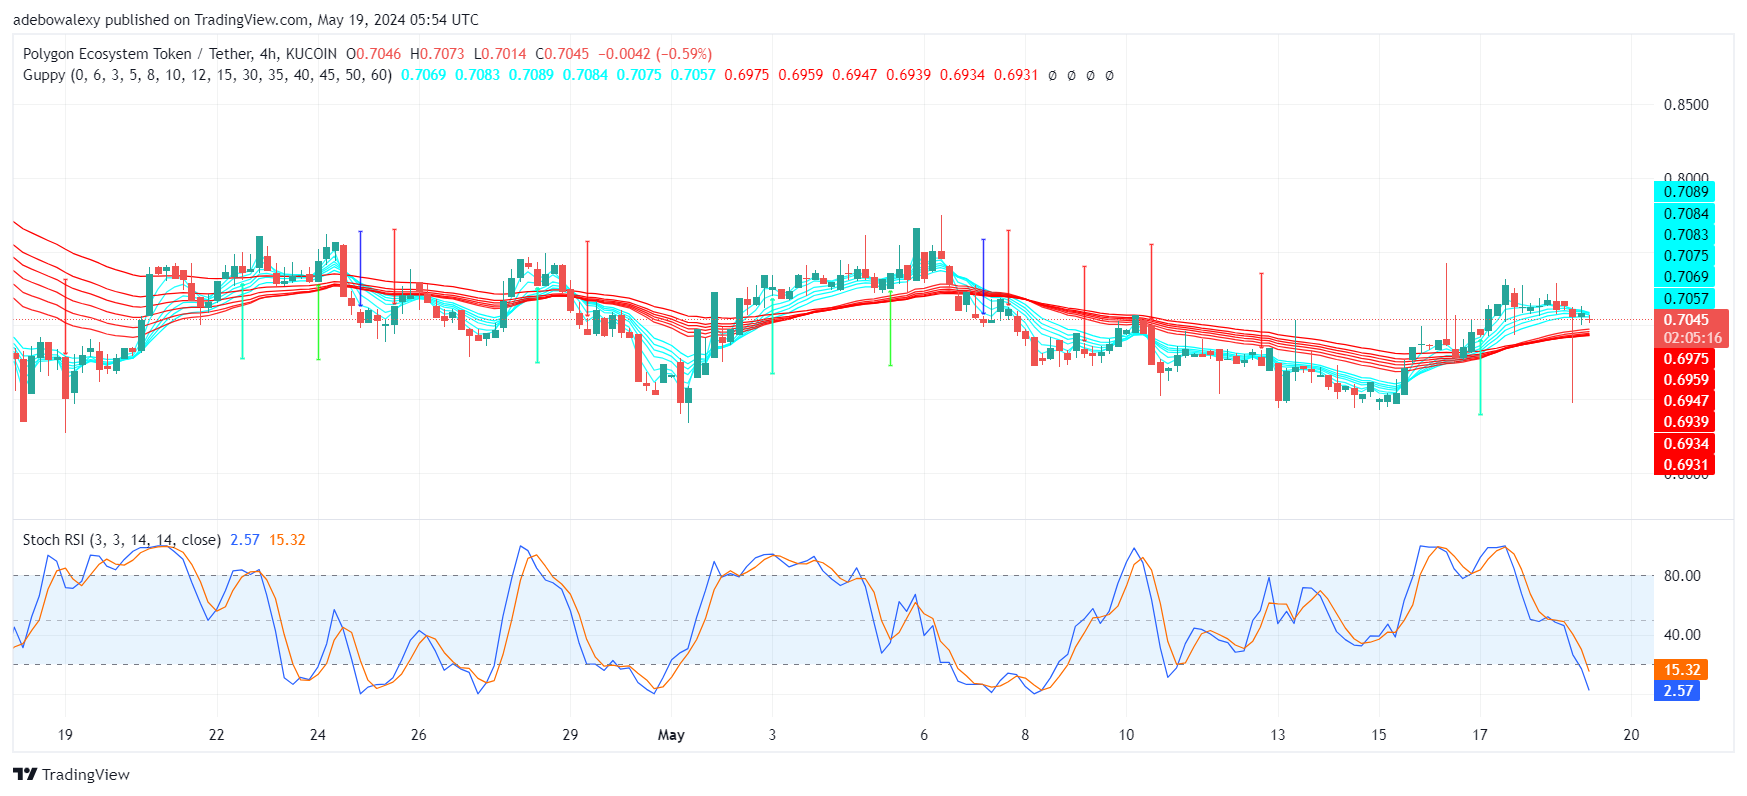
POL/USDT Medium-term Trend: Polygon Hopes of an Upside Rebound Look Possible (4H Chart)
The last price candle on the Polygon 4-hour price chart continues to maintain the impression that control of price movement is hotly contested. Nevertheless, the mentioned price candle seems to be hovering around the red GMMA indicator lines, which lie above the green lines of the indicator. However, the SRSI lines seem to have also fallen too fast into the oversold region on this front, consistent with the exaggerated movement noticed on the daily chart, only on the opposite side.
The movement of the SRSI indicator lines continues to point to the fact that market forces are trying to wear each other out. However, considering the appearance of the last price candle in between the GMMA lines, traders can still anticipate the continuation of the upside correction towards the $0.8000 mark at least.