Alchemy Pay (ACH/USD) Bull Run Pauses Above $0.010
Estimated Reading Time: 2 minutes
Don’t invest unless you’re prepared to lose all the money you invest. This is a high-risk investment and you are unlikely to be protected if something goes wrong. Take 2 minutes to learn more

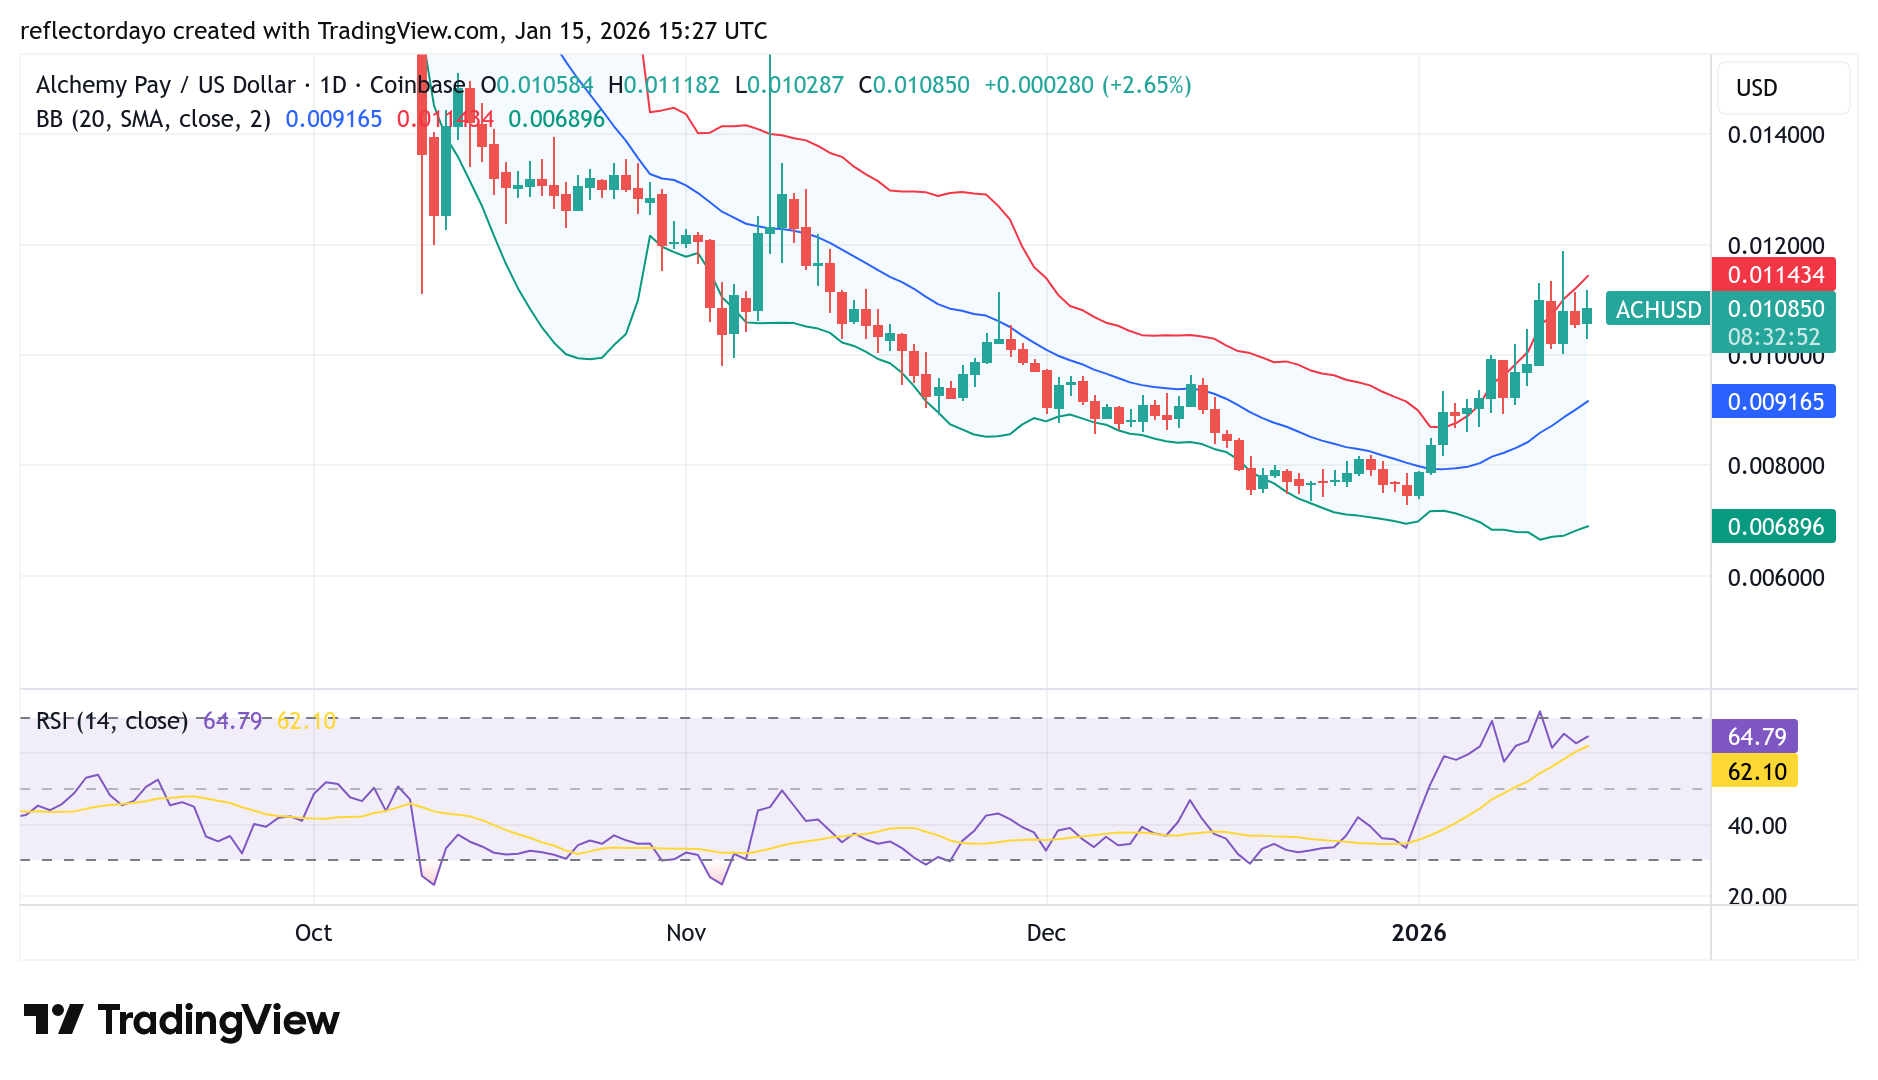
Alchemy Pay began trending upward at the start of January, with the rally originating around the $0.007 price level. This bullish momentum carried the market above the key $0.010 psychological threshold. However, attempts by bulls to extend the rally further have met resistance within the $0.0112–$0.012 price zone. As a result, the market has entered a consolidation phase, holding firmly above the $0.010 level.
Alchemy Pay (ACH/USD) Market Data
- ACH/USD Price Now: $0.0109
- ACH/USD Market Capitalization: $108 million
- ACH/USD Circulating Supply: 9.8 billion ACH
- ACH/USD Total Supply: 10 billion ACH
- ACH/USD CoinMarketCap Ranking: #266
‘It feels good to hit targets’
Key Levels to Monitor
- Resistance: $0.01125, $0.012, $0.0125
- Support: $0.009, $0.008, $0.009
Alchemy Pay Market Analysis: Technical Viewpoint
Initially, the Alchemy Pay market appeared largely one-sided, with bearish pressure remaining relatively weak as price maintained a steady upward trajectory from the beginning of the year. However, from January 12 onward, once the market reached a key resistance zone, selling pressure gained enough strength to match bullish momentum, pushing price into a ranging phase above the critical $0.01 level.
Today’s candlestick, which formed as a bullish spinning top, suggests a stalemate between demand and supply at current levels, highlighting growing market indecision.
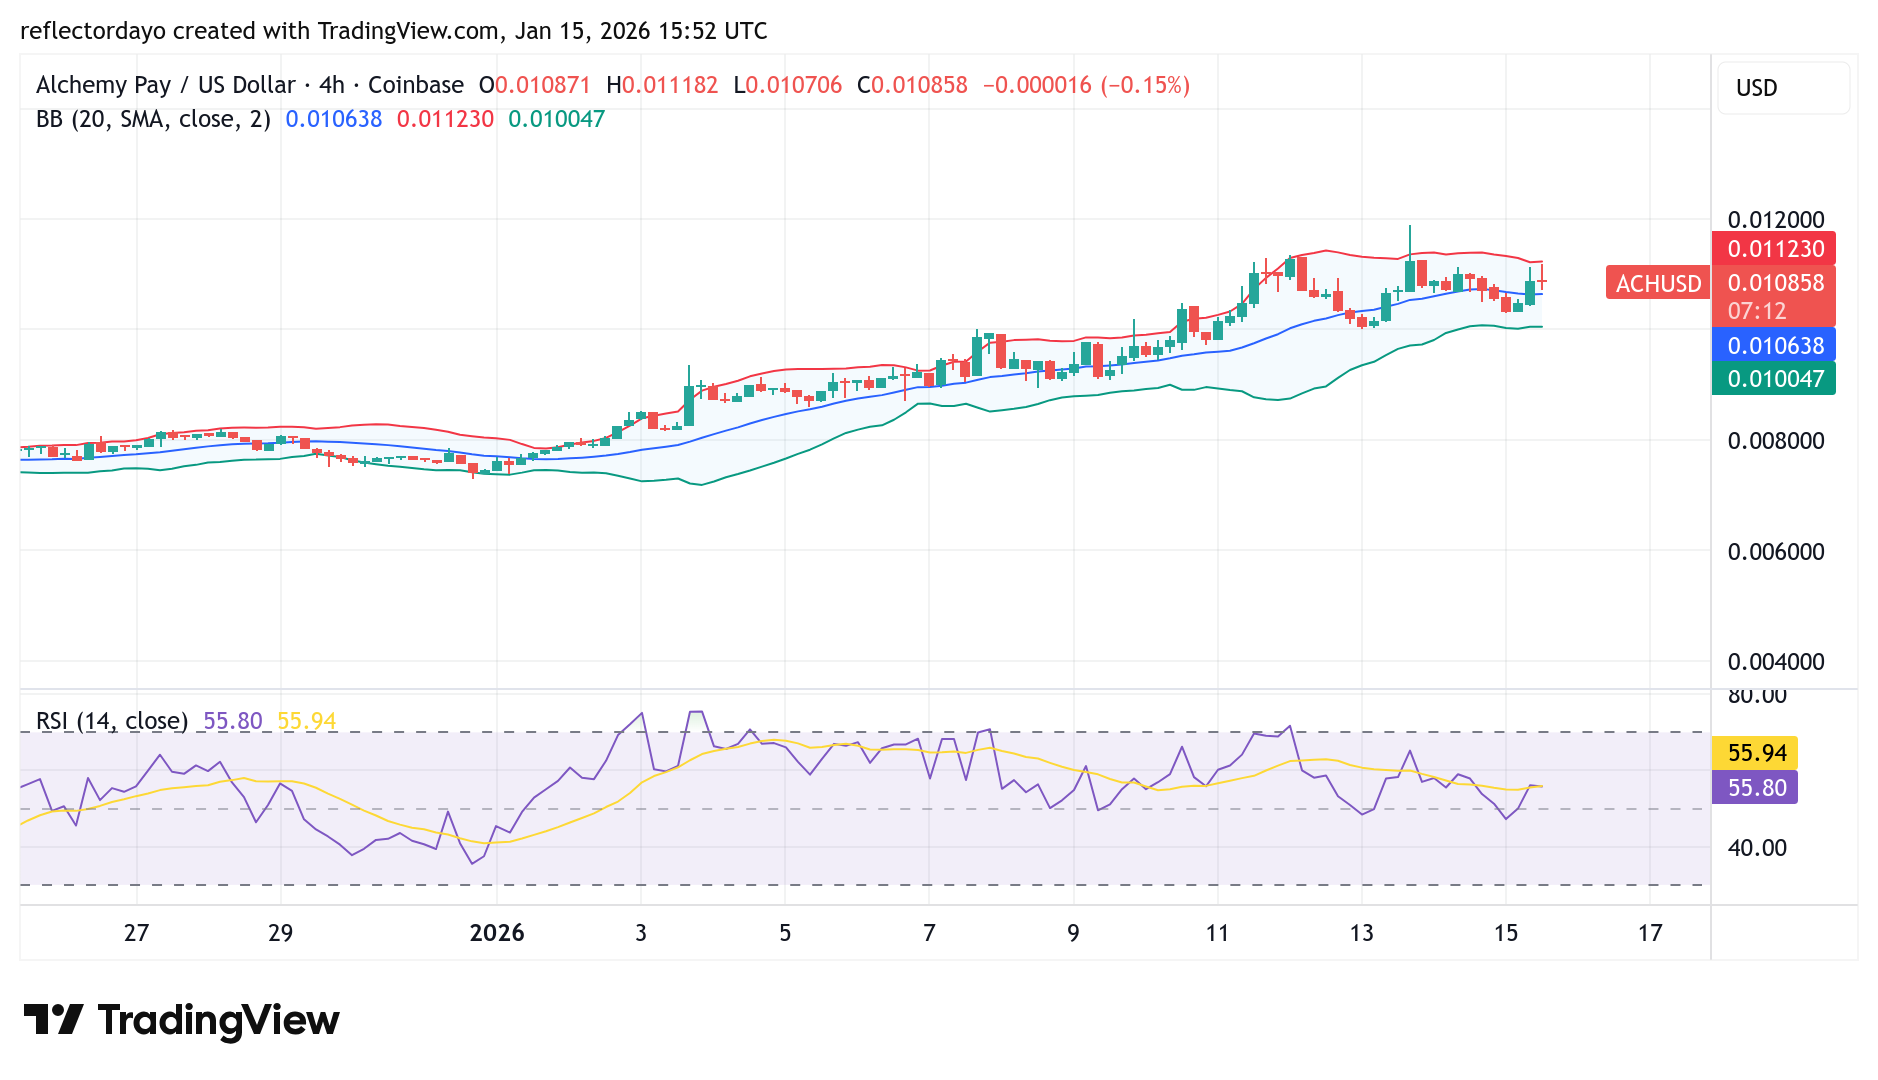
ACH/USD 4-Hour Chart Outlook
The market trend appears to be settling into a horizontal phase, as the Bollinger Bands—which were previously wide—have begun to converge into an increasingly narrow price channel. This contraction in volatility suggests that bearish pressure is starting to catch up with bullish momentum.
That said, bulls still retain a slight advantage, as the crypto signal continues to trade above the 20-period moving average. However, overall price action remains sideways, indicating consolidation rather than a clear directional move.