Algorand Market (ALGO/USD) Ascent Hits Resistance: Is a Price Correction Brewing at $0.30?
Estimated Reading Time: 3 minutes
Don’t invest unless you’re prepared to lose all the money you invest. This is a high-risk investment and you are unlikely to be protected if something goes wrong. Take 2 minutes to learn more

After a strong bullish rally that began on July 9, the Algorand (ALGO/USD) market appears to be losing steam as it approaches the critical $0.30 resistance zone. The surge was ignited when price action decisively broke out of a prolonged consolidation phase around $0.17, triggering renewed optimism among traders.
However, the momentum that once fueled the rally is now showing signs of exhaustion. Price action has begun to stall near $0.288, suggesting that bearish sentiment may be mounting in this region. The slowing pace of gains hints at a potential pullback, as sellers begin to test the strength of the bullish trend.
From a technical perspective, the current setup on the chart suggests that the market may be gearing up for a short-term correction. This would not be unusual following such a sharp climb and could offer opportunities for buyers to re-enter at more favorable levels—especially if the bulls can establish new support above former resistance.
As traders monitor the next move, all eyes remain on how ALGO behaves around this pivotal price level. A successful breakout above $0.30 could reignite bullish momentum, but a rejection might see the market retrace to test lower supports.
Algorand (ALGO/USD) Market Data
- ALGO/USD Price Now: $0.28
- ALGO/USD Market Cap: $2.4 billion
- ALGO/USD Circulating Supply: 8.6 billion
- ALGO/USD Total Supply: 10 billion
- ALGO/USD CoinMarketCap Ranking: #39
Key Levels
- Resistance: $0.30, $0.35, and $0.40
- Support: $0.20, $0.15, and $0.10
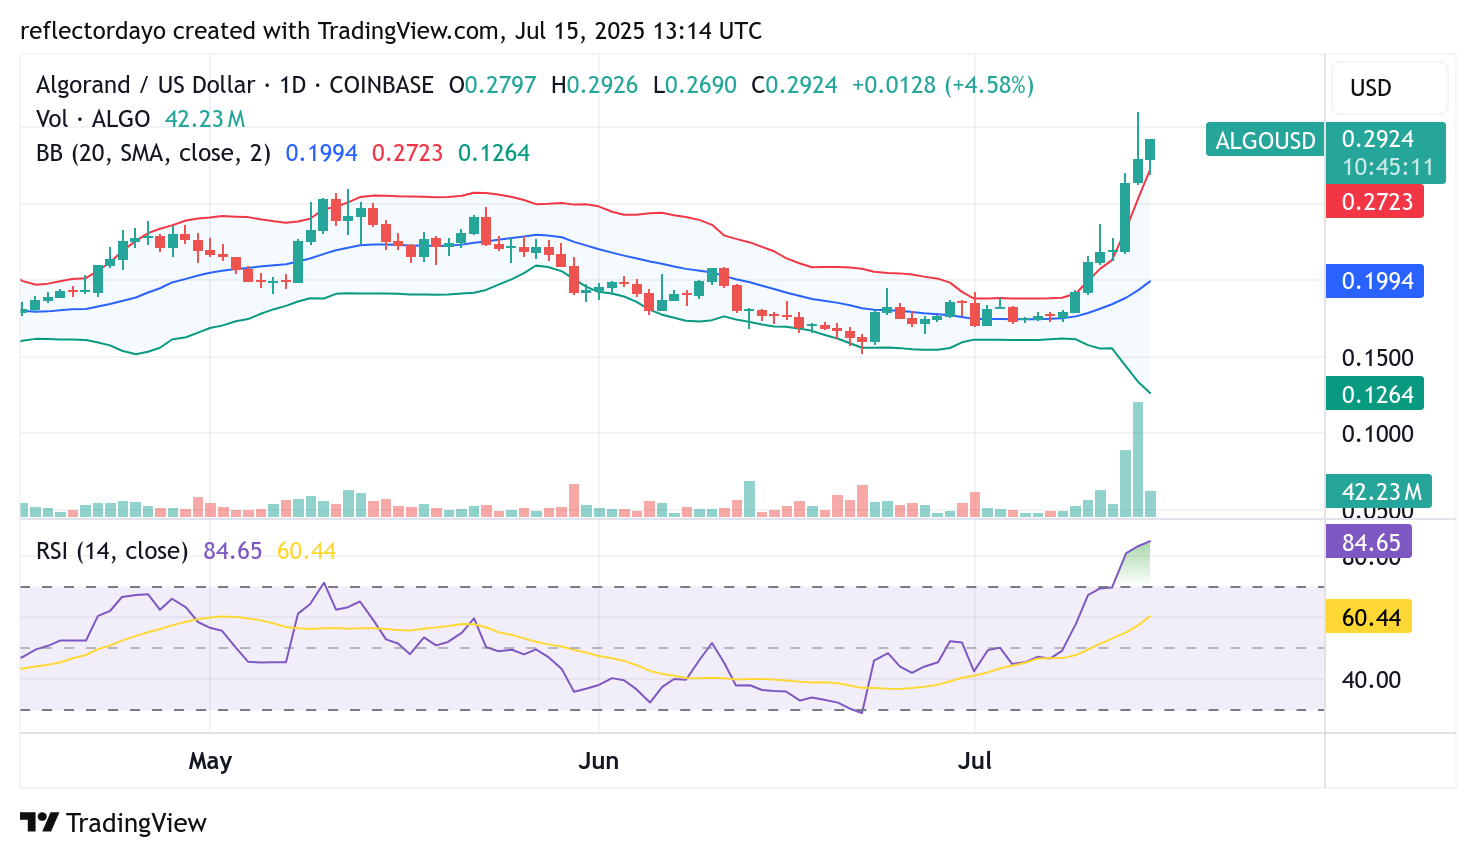
Algorand (ALGO/USD) Daily Chart Outlook: Bullish Momentum Meets Resistance
Algorand continues to show strong bullish momentum on the daily chart, but signs of a potential correction are emerging as the crypto signal approaches the $0.30 resistance zone amid rising volatility.
The RSI has entered overbought territory at around 84, suggesting the recent surge may be overextended. Volume remains strong, but the latest histogram shows a notable drop, indicating waning buying interest.
If a pullback deepens, support levels at $0.25 and $0.22 may attract buyers and offer potential reentry points. A stable base here could set the stage for the next leg up.
Traders should remain cautious of short-term volatility and watch for stabilization signs near key price levels before making new entries.
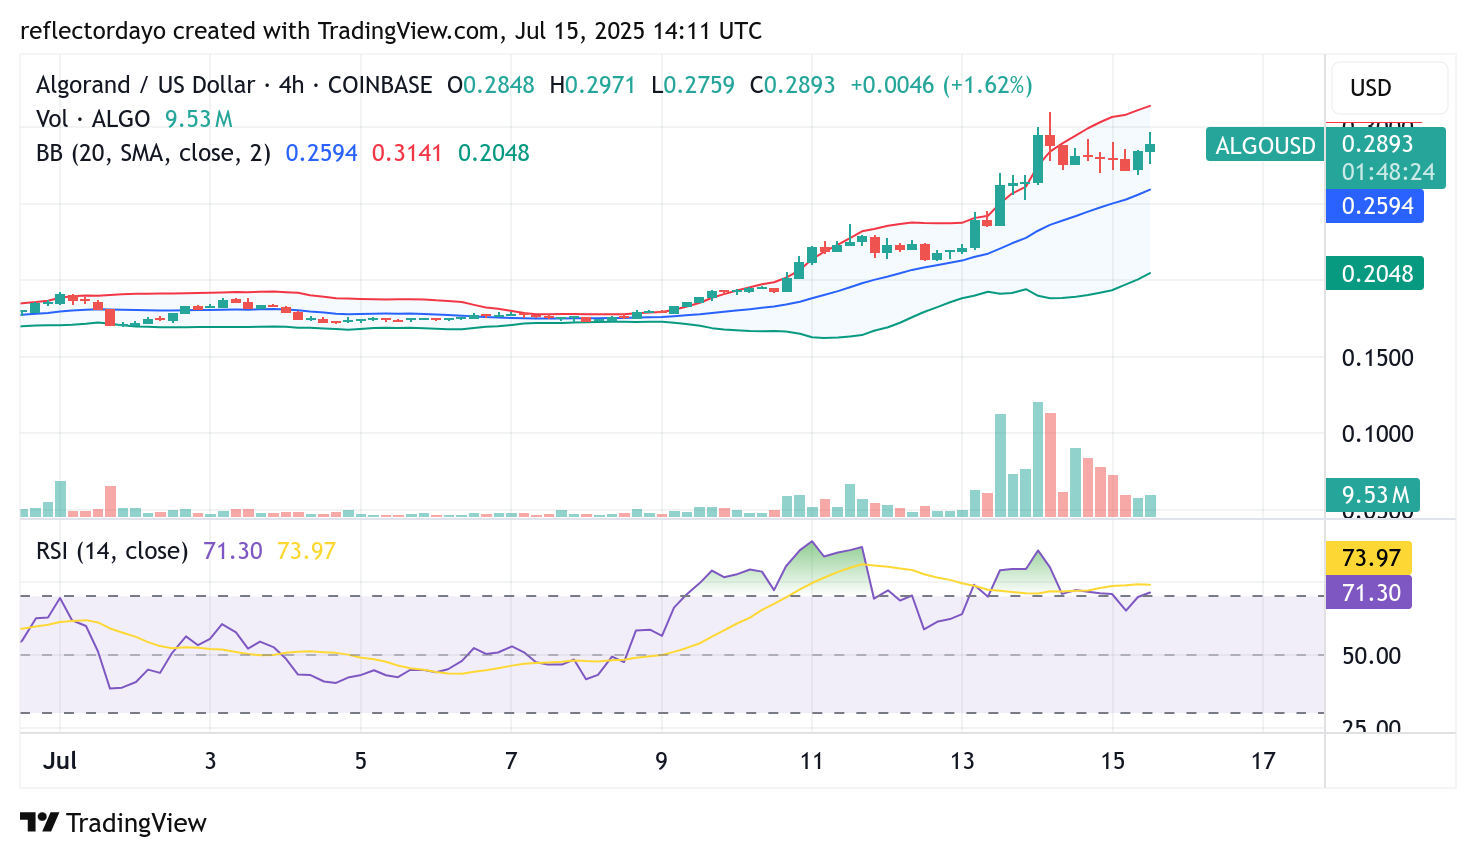
ALGO/USD 4-Hour Chart Analysis: Price Coils Between $0.27 and $0.30
The 4-hour chart for Algorand (ALGO/USD) shows a clear uptrend, supported by upward-sloping Bollinger Bands, indicating strong bullish momentum.
However, price action is now encountering a key resistance at $0.30, which has proven difficult to break. At the same time, support is forming around $0.27, showing buyers are stepping in to defend this level.
ALGO is currently trading within a narrow channel between these two zones, suggesting a potential consolidation phase. A breakout above $0.30 could trigger the next bullish leg, while a slip below $0.27 may lead to a short-term pullback.