Aptos (APT/USD) Market Becomes Attractive to Traders at $3.00
Estimated Reading Time: 3 minutes
Don’t invest unless you’re prepared to lose all the money you invest. This is a high-risk investment and you are unlikely to be protected if something goes wrong. Take 2 minutes to learn more

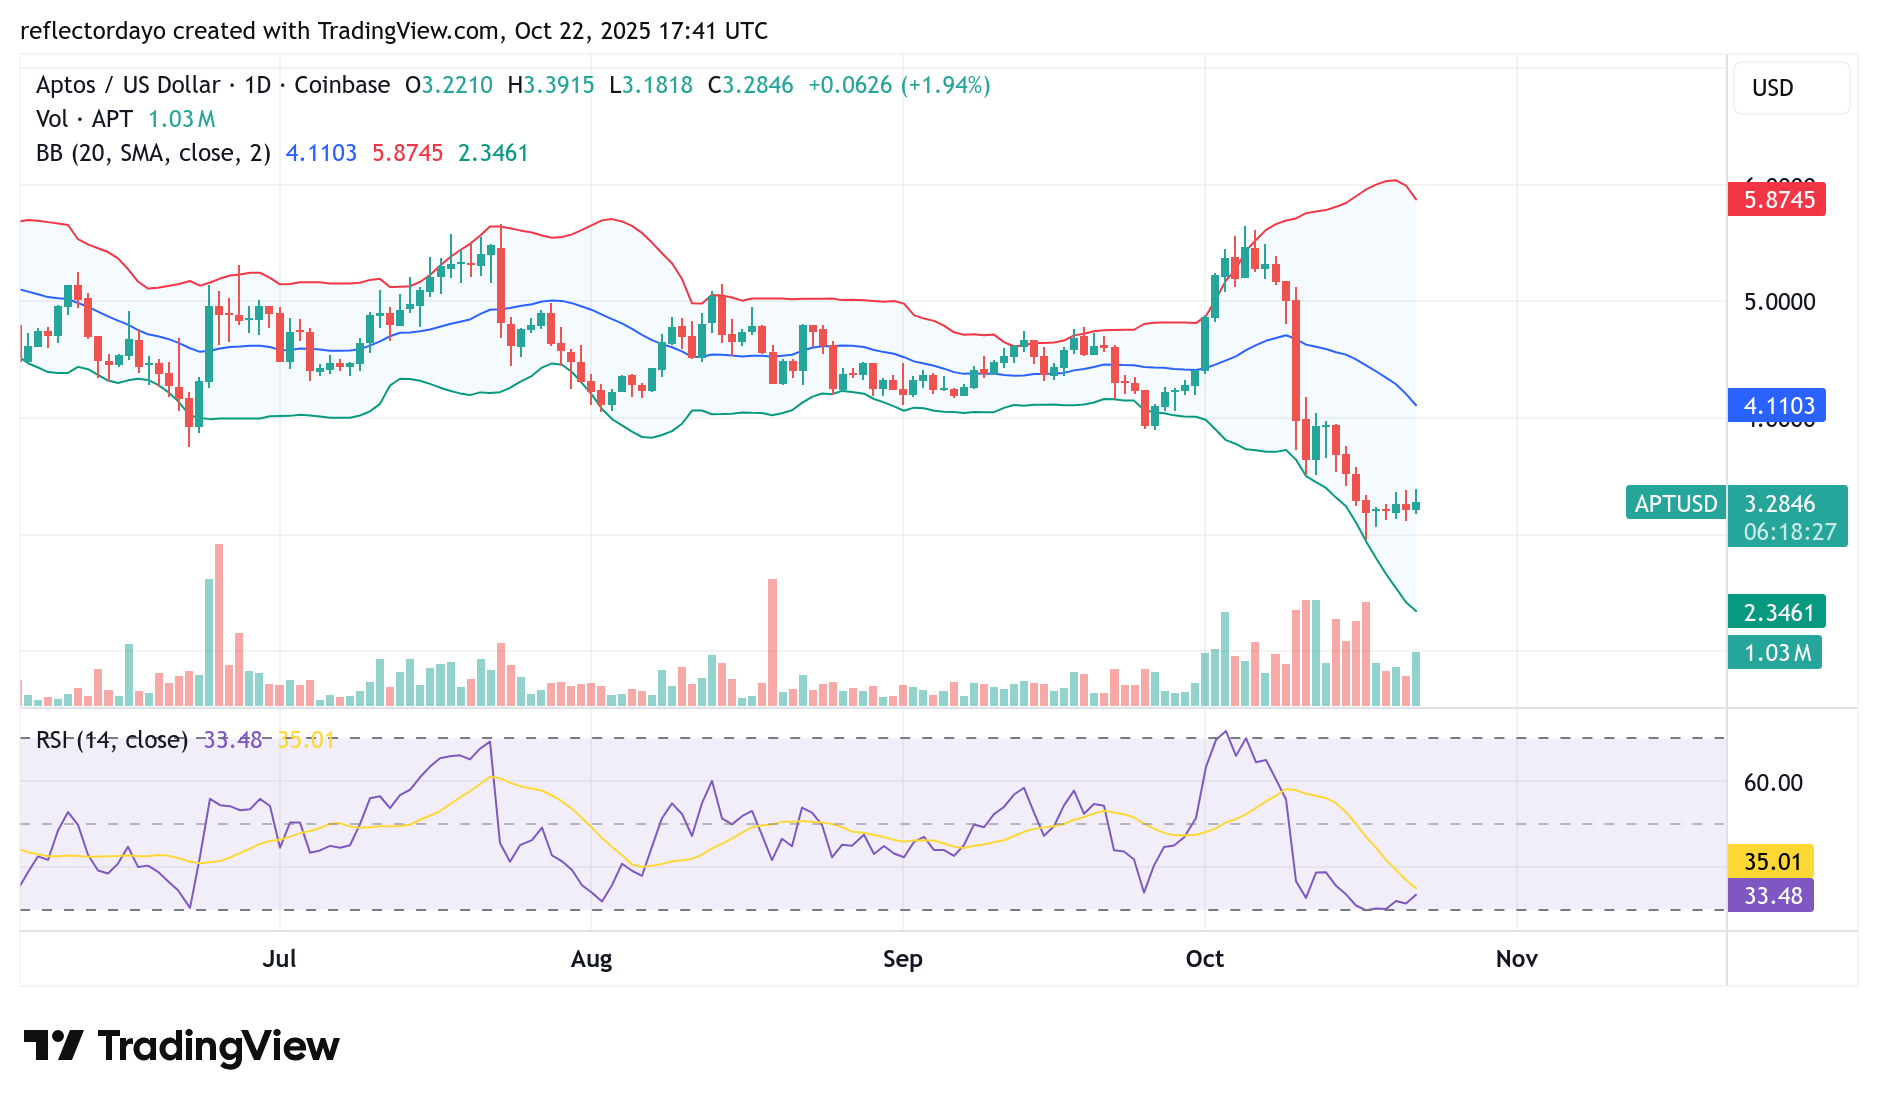
The Aptos market experienced significant volatility throughout October, as shown by the wide price swings between the $5.60 and $3.00 levels. However, by October 10, bearish sentiment took control, pushing the market deep into the bearish zone. A strong, dominant bearish candlestick on that day illustrated a sharp decline from the $5.00 level to around $4.00. Subsequent trading sessions showed continued downward pressure from the bears until the market reached the $3.00 level, where it began to attract renewed buying interest from bullish traders.
Aptos (APT/USD) Market Data
- APT/USD Price Now: $3.3
- APT/USD Market Cap: $2.3 billion
- APT/USD Circulating Supply: 718 million APT
- APT/USD Total Supply: 1.2 billion APT
- APT/USD CoinMarketCap Ranking: #41
Key Levels to Watch
- Resistance: $3.50, $4.00, $4.50
- Support: $3.00, $2.50, $2.00
Aptos (APT/USD) Daily Chart Outlook
The Bollinger Bands indicator highlights the strong volatility observed in recent trading sessions, a condition the bears have capitalized on to drive the market down to the $3.00 threshold. However, as bearish momentum shows signs of exhaustion at this level, buying interest from Aptos bullish traders is beginning to emerge.
Despite this development in the crypto signal, bullish sentiment remains relatively weak and has not yet sparked a significant recovery. Currently, market sentiment appears balanced, with bulls and bears locked in a struggle around this key support zone—indicating that bearish pressure still holds notable influence.
Meanwhile, the volume histogram shows a gradual decline, suggesting a reduction in volatility. This could imply that the market is entering a brief consolidation phase before a potential major move—most likely, a bullish recovery.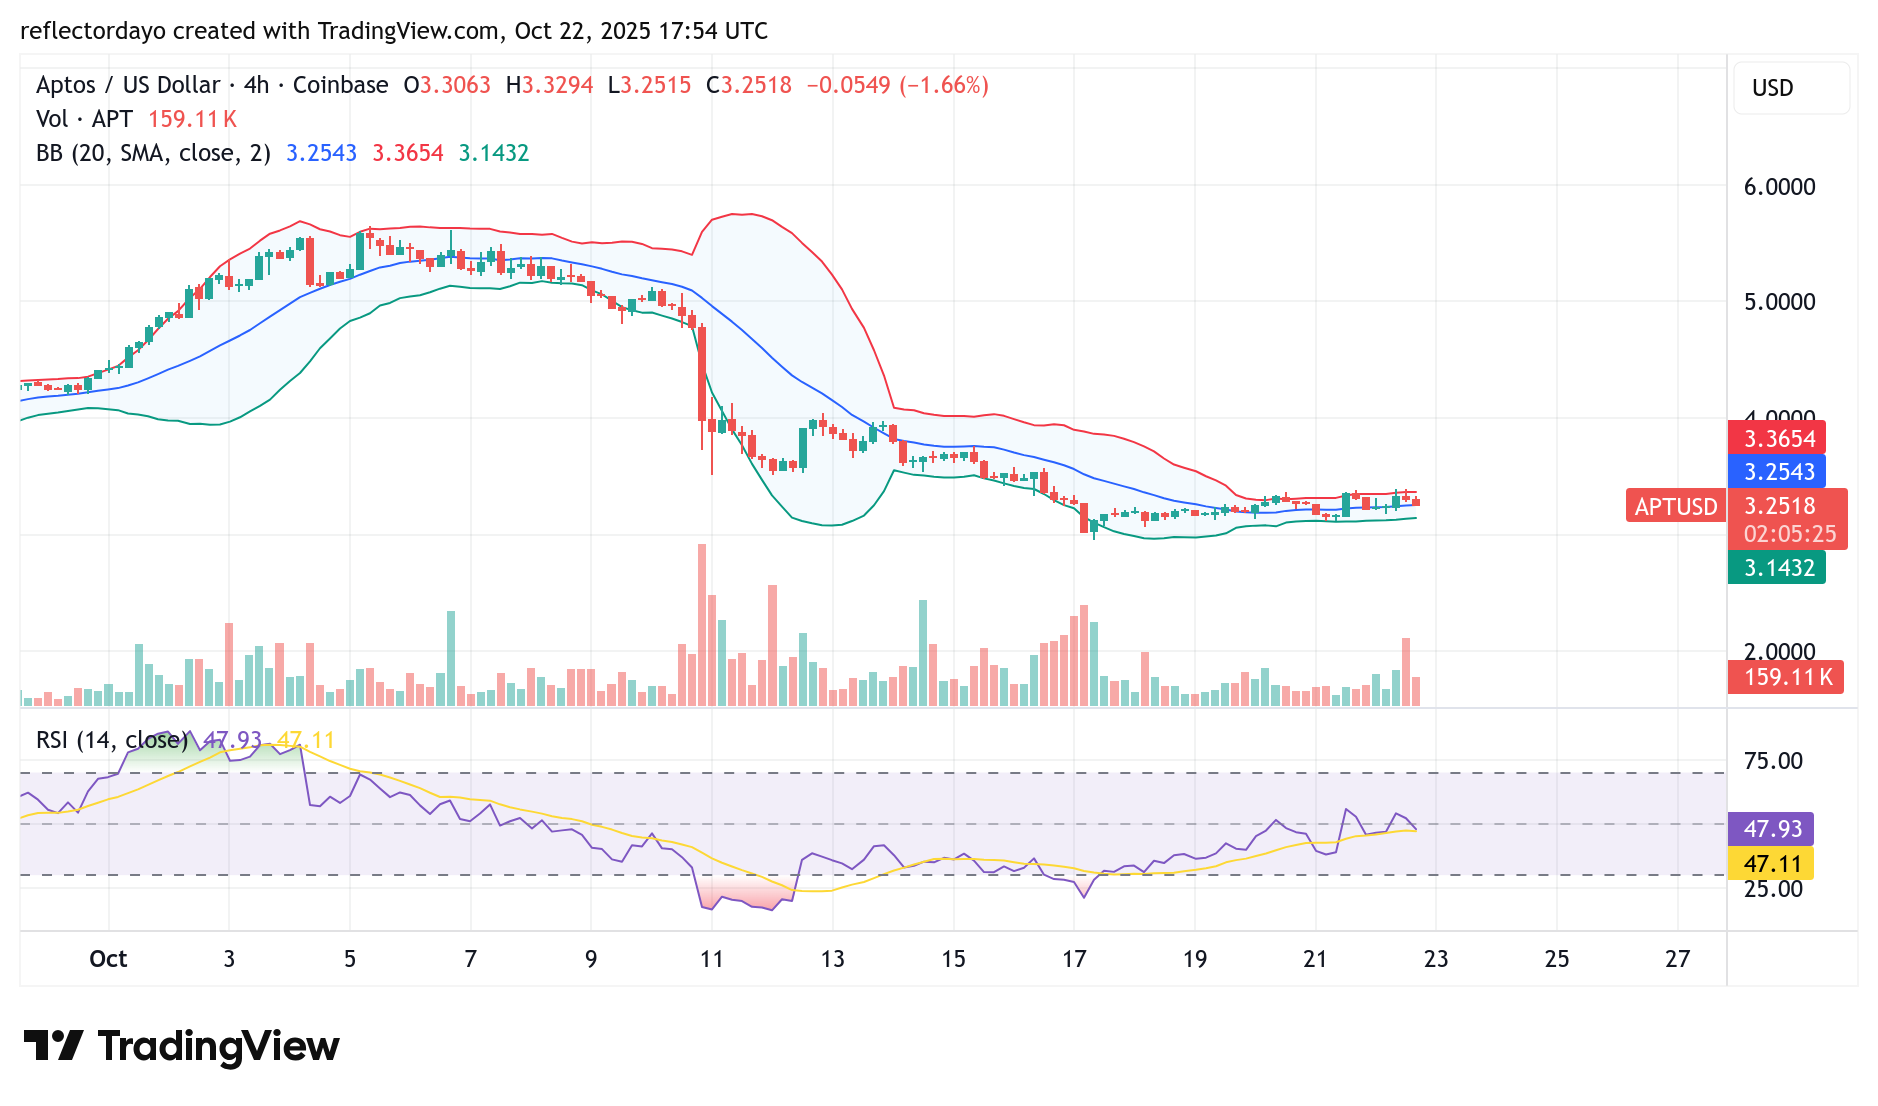
APT/USD 4-Hour Chart Outlook
On the shorter timeframe, the Aptos market has settled into a consolidation phase, with the Bollinger Bands converging to form a narrow price channel around the current price action. However, a closer look reveals a gradual upward tilt in the market’s movement, suggesting a slow buildup of bullish momentum.
This steady climb has continued until the $3.38 price level, which has now been identified as a key resistance zone. Traders should watch closely for a potential breakout above this level, as a successful breach could signal a shift in market sentiment and possibly mark the beginning of a new upward trend.

