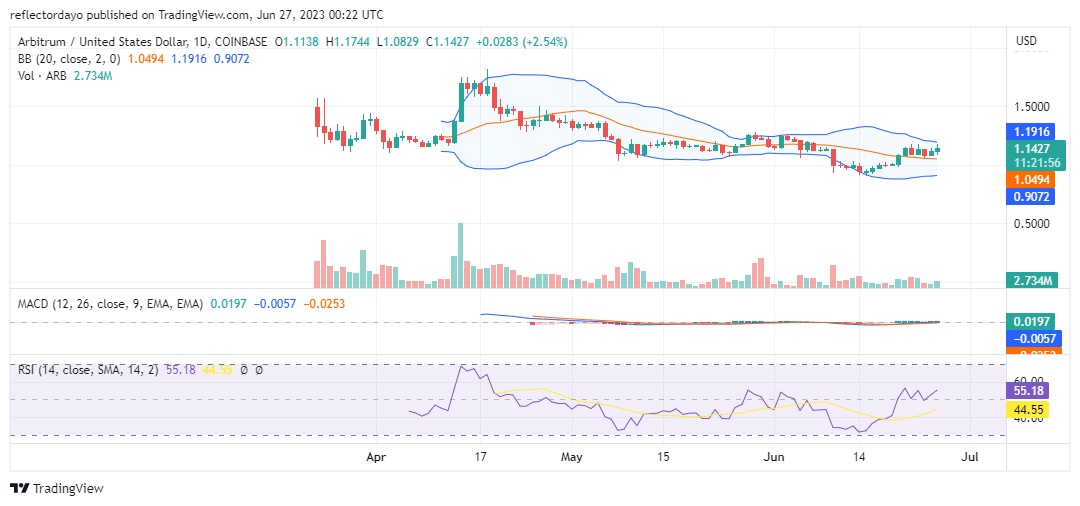
Arbitrum (ARB/USD) Rallies Back to the $1.200 Price Level
Estimated Reading Time: 2 minutes
Don’t invest unless you’re prepared to lose all the money you invest. This is a high-risk investment and you are unlikely to be protected if something goes wrong. Take 2 minutes to learn more
The Aribitrum market is now set to continue dealing with the $1.200 resistance price level; this is the point the market fell from as the general bear market of the past few weeks affected it, forcing it to fall to the $0.9115 price level. Now the market is back within the formal price zone. However, there has been a struggle at the $1.100 price level since June 20, but bulls were finally able to lift the market above it in today’s market.
Arbitrum Market Data
- ARB/USD Price Now: $1.14
- ARB/USD Market Cap: $1,458.961,584
- ARB/USD Circulating Supply: 1,275,000,000 ARB
- ARB/USD Total Supply: 10,000,000,000
- ARB/USD CoinMarketCap Ranking: #35
Key Levels
- Resistance: $1.700, $1.200, and $1.500
- Support: $1.050, $1.000, and $0.900.
Price Prediction for Arbitrum: The Indicators’ Point of View
The Arbitrum market hit the year’s high on April 18 at the $1.826 price level before it began its downward journey; however, the bearish trend was trapped into a consolidation trend at the $1.0653 and $1.2534 price levels. The market saw strong selling on June 10 and June 14, and it finally found solid ground at $0.9114 on June 14.
After the bullish support was formed, we noticed a bullish divergence pattern between the price action and the volume of trade histograms. This was a sign that bulls are becoming stronger. The Relative Strength Index supports this sentiment; its line measures at the 54.93 level in the indicator, showing that bulls slightly have the upper hand. However, more bullish action is needed to launch the market out of the consolidation trend.
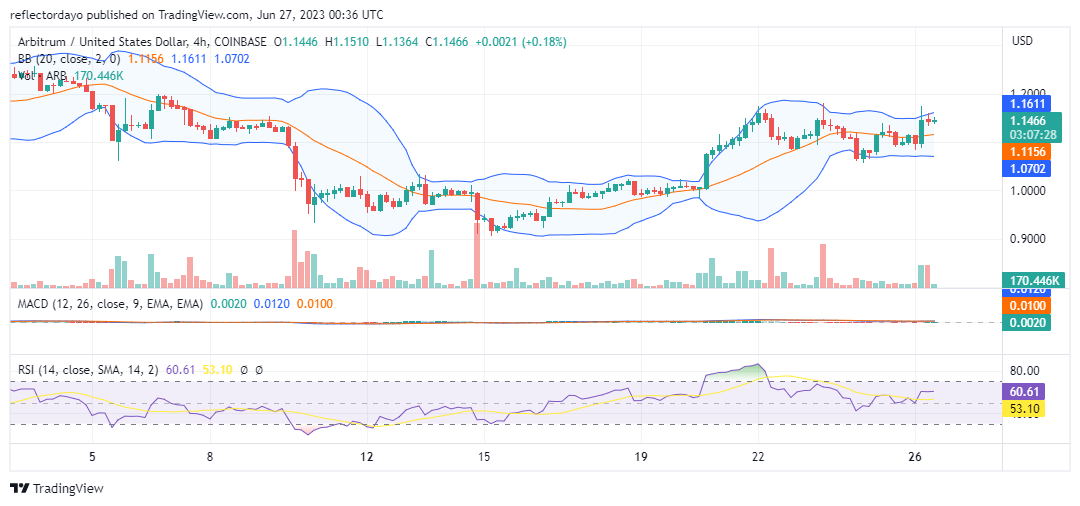
ARB/USD 4-Hour Chart Outlook
From the 4-hour chart perspective on the market, we discover that traders are bearishly biased at the $1.1623 price level, but bullish pressure remains at the same level. As a result of this, the market continues to move along the horizontal axis. The low volume of trade seems to be causing a lack of consistency in both the bull and bear markets.
A few occasional spikes here and there in both markets might not be sufficient to set the market on a clear course.