Balancer (BAL/USD) Penetrates Deeper into the Demand Zone
Estimated Reading Time: 3 minutes
Don’t invest unless you’re prepared to lose all the money you invest. This is a high-risk investment and you are unlikely to be protected if something goes wrong. Take 2 minutes to learn more
During the period between mid-June and mid-July, the Balancer (BAL/USD) market exhibited high volatility and a lack of clear direction. The price action unfolded within a broad range of $4.50 to $5.10, signifying volatile market sentiment and indecision among traders.
Initially, in the second half of June, the support level was identified at $4.15, while the resistance level stood at $5.00. However, by the end of June, these levels had shifted, with support adjusting to $4.50 and resistance adjusting to $5.10. This adjustment in levels signifies changing market dynamics and potential shifts in supply and demand.
Balancer Market Data
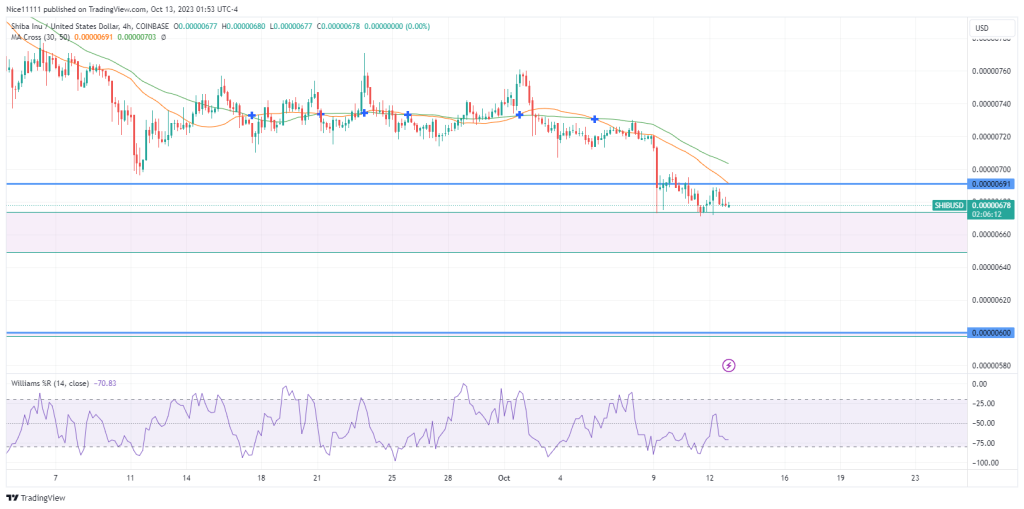
- BAL/USD Price Now: $4.02
- BAL/USD Market Cap: $200,400,015
- BAL/USD Circulating Supply: 51,56,1669 BAL
- BAL/USD Total Supply: 58,562,744 BAL
- BAL/USD CoinMarketCap Ranking: #132
Key Levels
- Resistance: $5.50, $6.00, and $6.50.
- Support: $4.00, $3.50, and $3.00.
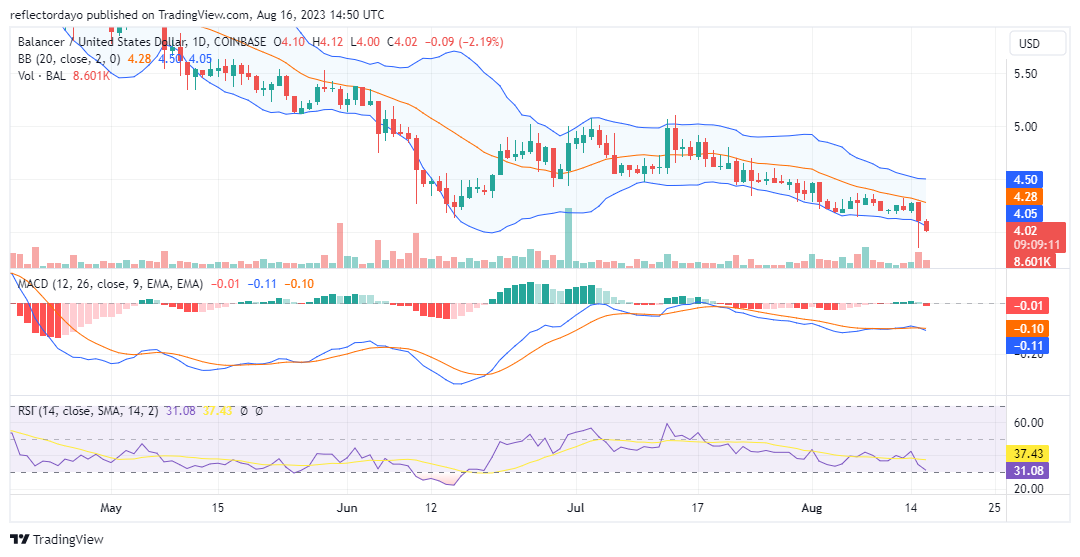
Price Prediction for Balancer: The Indicators’ Point of View
On July 14th, a significant bearish event transpired as the Balancer market encountered a notable resistance level at $5.10. This resistance prompted a bearish reversal, catalyzing a downward spiral in prices. Ultimately, the market reached its lowest point of the year, reaching $3.86 in the recent trading sessions. This pronounced decline signifies a strong bearish sentiment during this period.
Given the extent to which the bulls have ventured into bullish territory, there is potential for the market to shift in favor of the buyers. Buyers might congregate around the $4.00 price level, potentially leading the market to pivot in their favor.
The Relative Strength Index (RSI) underscores the depth of bearish sentiment in the market due to the sharp decline observed over recent days. The price is hovering in proximity to the oversold threshold, indicating that the market could be approaching a state of exhaustion concerning downward momentum. This scenario might signal a prospective reversal or bounce.
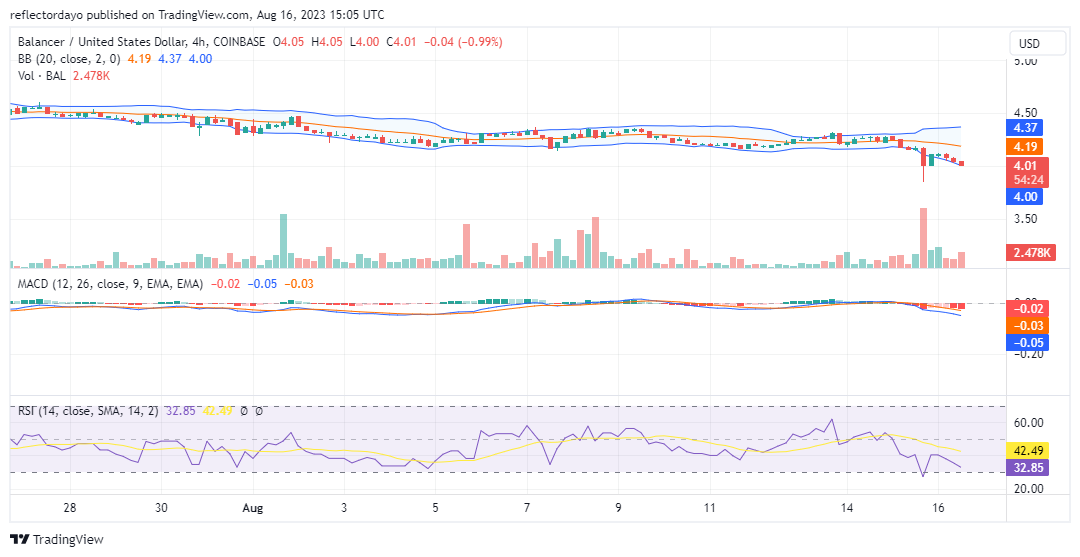
BAL/USD 4-Hour Chart Outlook
Examining the 4-hour chart, the bear market exhibited a noticeable and dramatic increase in liquidity. This was vividly depicted by a distinct spike in the trade volume indicator during the final 4-hour session of the preceding day. Traders capitalized on this price dip, seizing the opportunity to initiate long positions and seek shelter at the $4.00 support level. There is potential for a market shift in favor of buyers in this vicinity.