Biconomy (BICO/USD) Bulls Gain Momentum, Eyeing a Breakout Beyond the $0.40 Mark
Estimated Reading Time: 3 minutes
Don’t invest unless you’re prepared to lose all the money you invest. This is a high-risk investment and you are unlikely to be protected if something goes wrong. Take 2 minutes to learn more
The bull market that concluded at the end of last year reached its peak on Christmas Eve. Although the Biconomy market had been trending upward since October, it gained additional bullish momentum in December. However, since December 24, bears have assumed control of the market, maintaining dominance even until January 7. On this date, the market established a crucial support level around the $0.32 price mark, which is below the expected historical support level of December.
Biconomy Market Data
- BICO/USD Price Now: $0.3842
- BICO/USD Market Cap: $242,916,101
- BICO/USD Circulating Supply: 627,342,828 BICO
- BICO/USD Total Supply: 1,000,000,000 BICO
- BICO/USD CoinMarketCap Ranking: #182
Key Levels
- Resistance: $0.40, $0.45, and $0.50.
- Support: $0.35, $0.30, and $0.25.
Biconomy Market Forecast: Analyzing the Indicators
The bear market exerted downward pressure on the market, breaching the crucial support level of $0.35. This price level also holds significance as a historical launching point for the bull market that peaked on December 24 at a notable high of $0.49. Initially, there were anticipations that the Biconomy market might rebound from this level, but such a reversal did not materialize. Instead, bulls discovered new support, establishing solid ground beneath this critical price level.
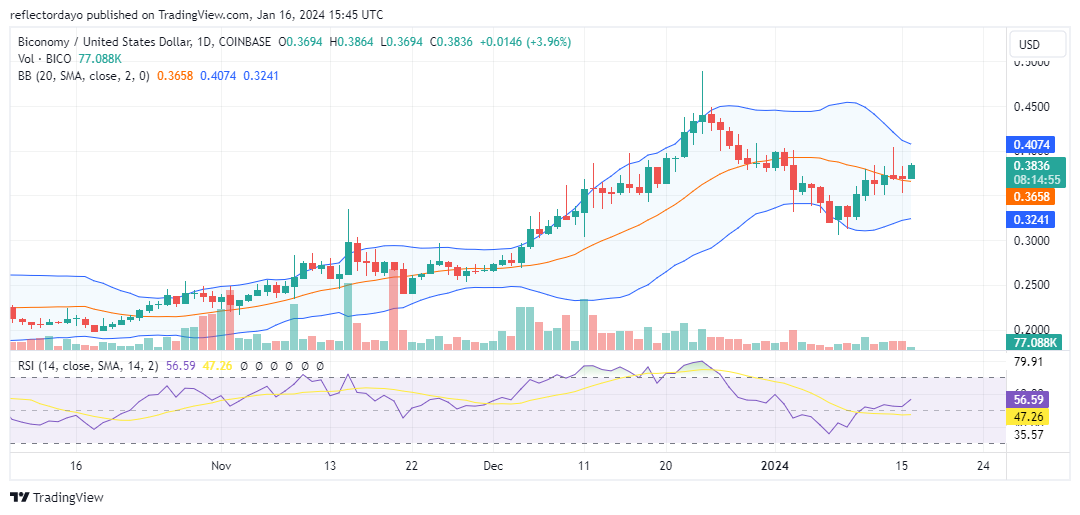
Although a bullish recovery is underway, the lingering bearish presence is palpable, creating a conflict around the $0.37 price level. In today’s trading session, the bulls have thus far dominated the market. However, the presence of a small upper shadow on the candlestick, coupled with the market’s behavior on January 14, suggests a potential formidable bearish resistance at the $0.40 price level. This anticipation is supported by the modest size of today’s histogram in the volume of trade indicator, indicating that bulls may face challenges overcoming resistance at this level.
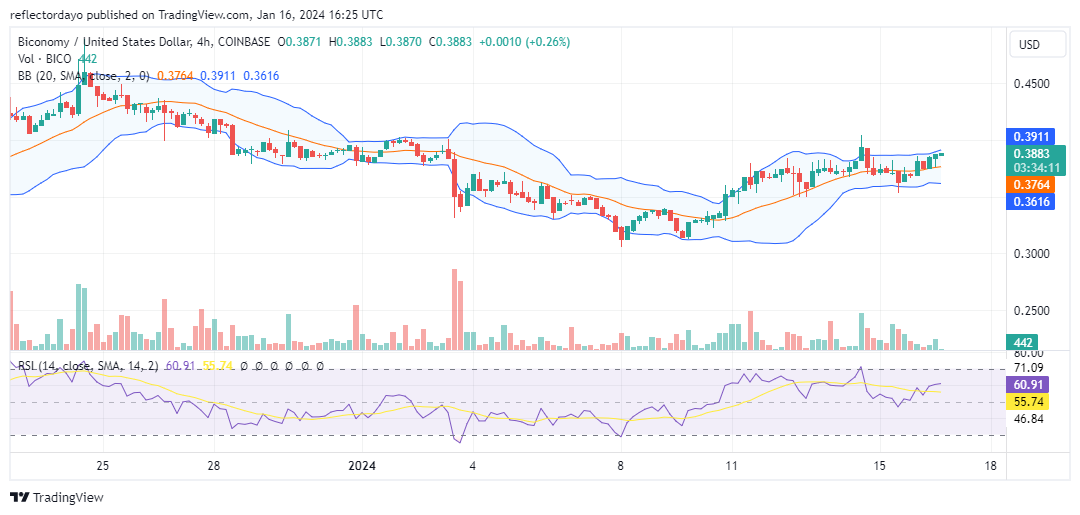
BICO/USD 4-Hour Chart Outlook
From a smaller chart perspective, the market exhibits characteristics of a deadlock situation. The price action is confined within a narrow price channel, as depicted by the Bollinger Bands. These bands illustrate a range between $0.36 and $0.39. Despite the market maintaining a position above the 20-day moving average, the ongoing bullish recovery is encountering substantial resistance. Contributing to the sluggishness of the bullish momentum is the low level of investor interest, evident in the volume of trade indicators displaying small histograms.
While there is a possibility that the price may eventually reach the $0.40 mark, it is anticipated to face rejection, leading to a return within the established ranging channel.