Bitcoin (BTC/USD) Price Analysis: BTC Endures Aggressive Headwinds Near $85,000
Estimated Reading Time: 4 minutes
Don’t invest unless you’re prepared to lose all the money you invest. This is a high-risk investment and you are unlikely to be protected if something goes wrong. Take 2 minutes to learn more
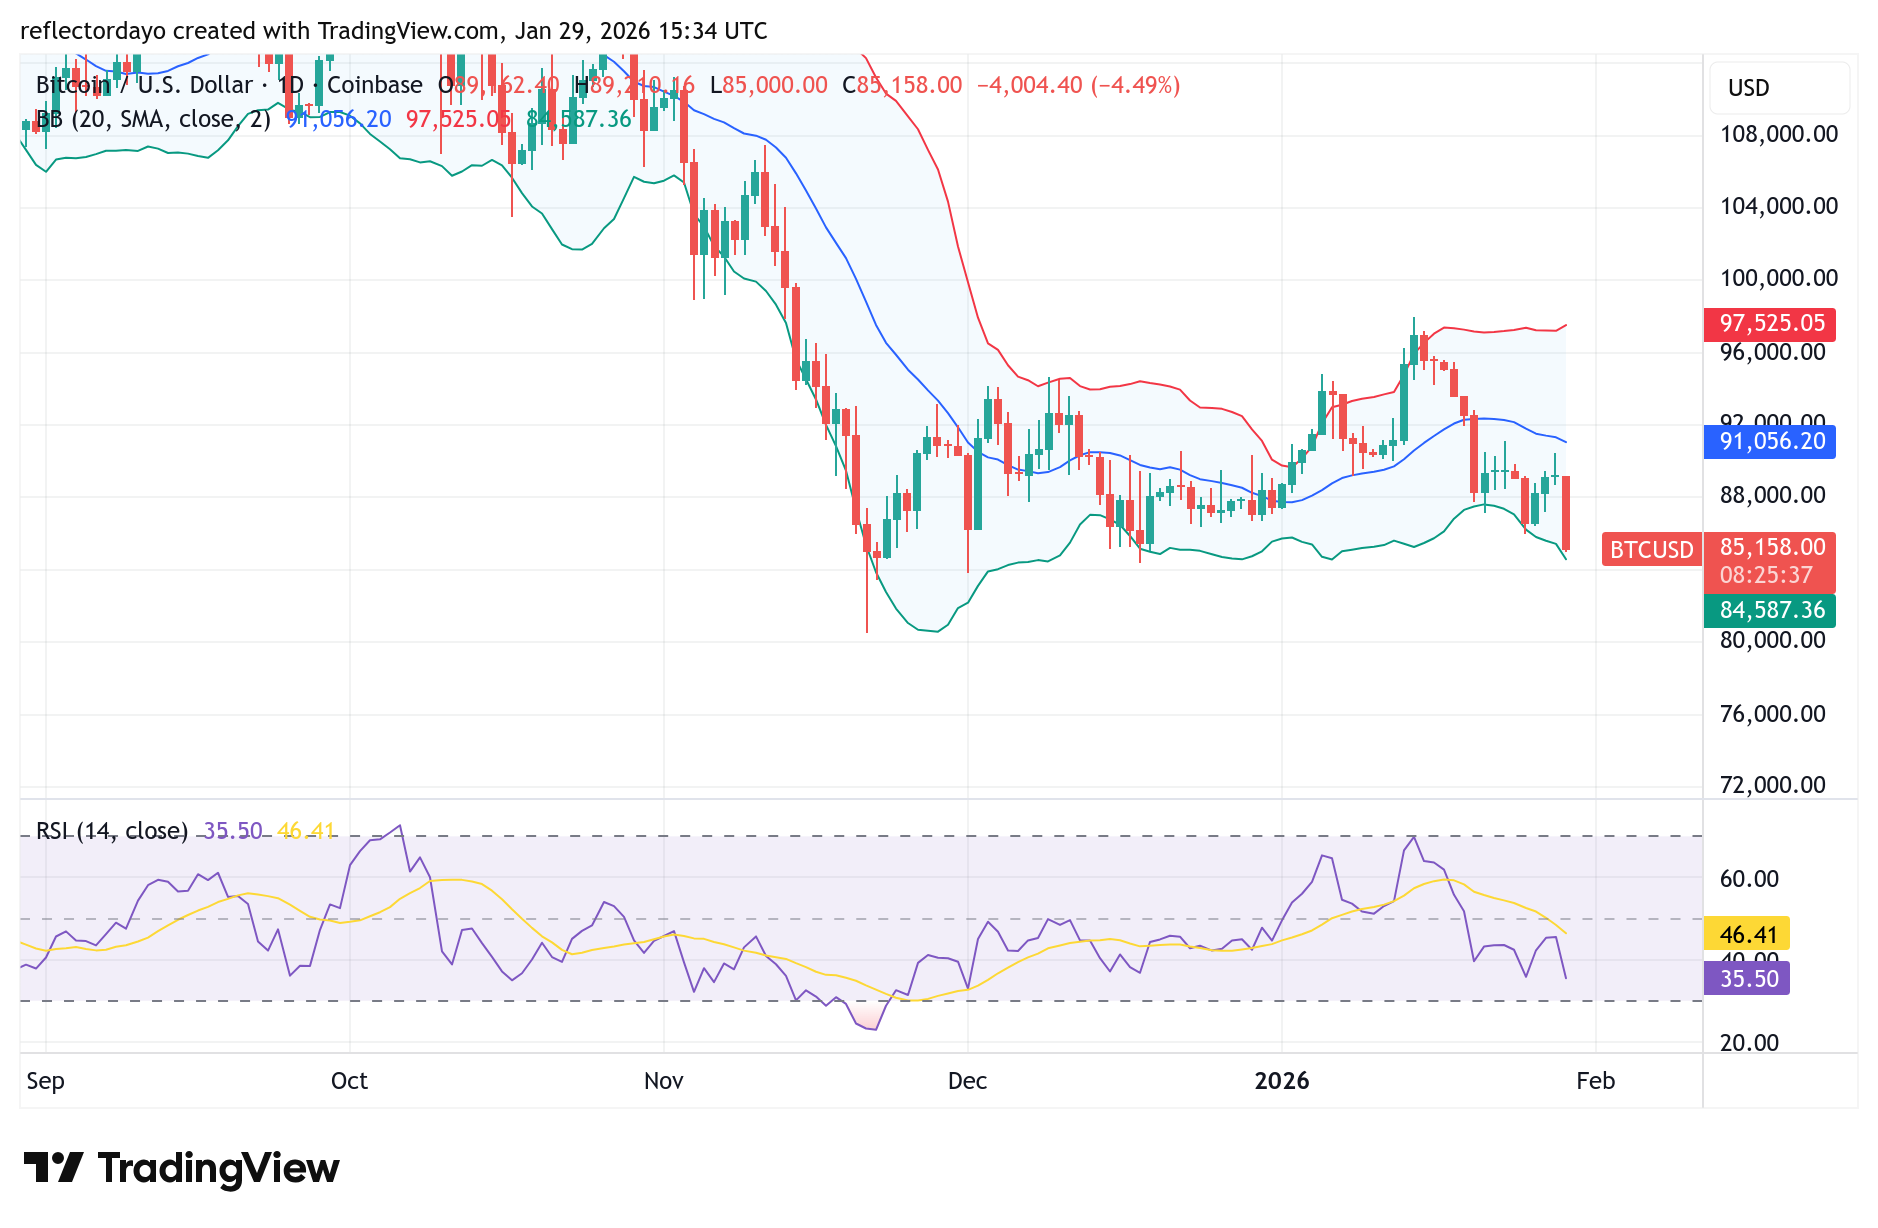
The Bitcoin market remains under bearish pressure, driven by a combination of economic factors including geopolitical tensions, competition from traditional safe-haven assets, and broader macroeconomic headwinds. Since the market’s decline from above the $100,000 level in November last year, price action has largely moved sideways below this psychological barrier. Despite several attempts to reclaim the $100,000 mark, each rebound has been met with strong resistance, keeping Bitcoin locked in a prolonged consolidation phase beneath this key level.
Bitcoin (BTC/USD) Market Data
- BTC/USD Price Now: 85,125
- BTC/USD Market Capitalization: 1.69 trillion
- BTC/USD Circulating Supply: 19.89 million BTC
- BTC/USD Total Supply: 19.89 million BTC
- BTC/USD CoinMarketCap Ranking: #1
Bitcoin’s Price Action Sets the Tone for the Broader Crypto Market
In the embedded video, the analyst emphasizes Bitcoin’s dominant role in shaping the direction of the entire cryptocurrency market. As the original and most influential digital asset, Bitcoin typically leads major market moves, with capital flowing from BTC into Ethereum, large-cap altcoins, and eventually mid- and small-cap tokens once momentum strengthens. The video notes that Bitcoin has been trading in a range over the past month, briefly approaching the $100,000 level before retreating to the low $90,000 region. Despite relatively muted price action and ongoing position liquidations by market makers, the analyst suggests this period of consolidation could be a precursor to the next bullish impulse. A sustained move into the mid-$90,000 zone is highlighted as a key condition for a renewed push above $100,000, which would likely signal the start of broader altcoin activity. However, the analyst also expresses caution, noting that any break above $100,000 may struggle to hold for an extended period, reinforcing Bitcoin’s role as the market’s primary gatekeeper for the next phase of the crypto cycle.
Key Levels to Monitor
- Resistance: $90,000, $91,000, $92,000
- Support: $84,000, $83,000, $82,000
BItcoin Market Analysis: Technical Viewpoint
Despite the intensity of the recent pullback, Bitcoin’s broader structure still reflects a consolidation regime rather than the onset of a sustained bearish cycle. Price action remains compressed within the $84,000–$94,000 range, suggesting the market is digesting the strong upside expansion recorded during the 2025 rally. This range-bound behavior indicates equilibrium between profit-taking pressure and renewed accumulation. Notably, the 2026 yearly open continues to act as a key price magnet, attracting liquidity and guiding short-term directional bias, as traders recalibrate positions around this macro reference level. Until a decisive breakout or breakdown occurs in the crypto signal beyond this zone, Bitcoin’s market structure is likely to remain neutral-to-constructive.
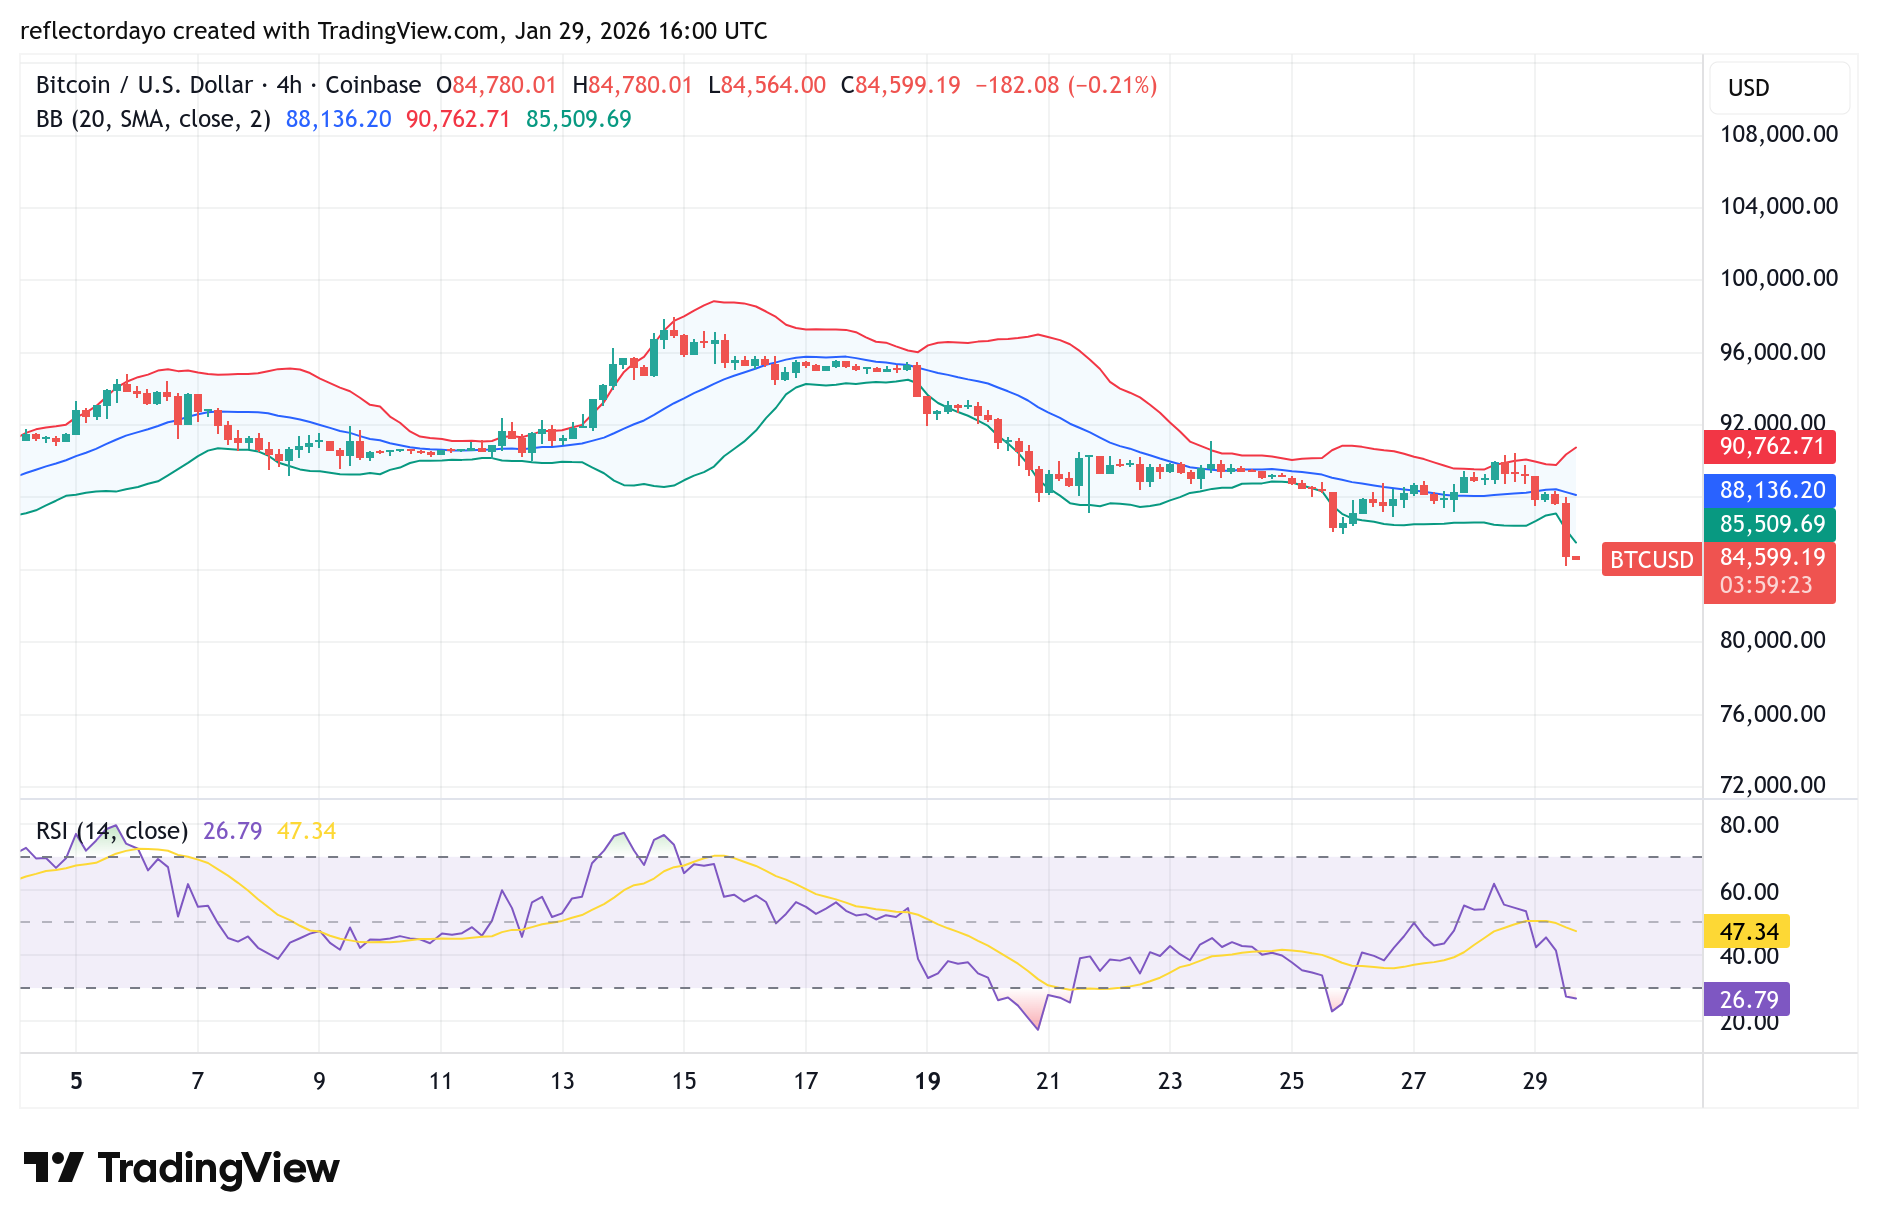
BTC/USD 4-Hour Chart Outlook
On the 4-hour chart, Bitcoin is experiencing a strong bearish move within the current trading session, pushing the RSI into oversold territory and highlighting short-term selling exhaustion. While the intraday trend remains bearish, such conditions often signal a potential pause or brief corrective bounce, especially as price tests the $84,000 support zone. A rebound, however, would require clear rejection signals on the 4-hour timeframe; otherwise, downside pressure is likely to persist, and any long setup should be treated as a short-term countertrend trade.