Bitcoin Cash (BCH/USD) Shows Strong Upward Momentum, Fails to Sustain Above $500
Estimated Reading Time: 3 minutes
Don’t invest unless you’re prepared to lose all the money you invest. This is a high-risk investment and you are unlikely to be protected if something goes wrong. Take 2 minutes to learn more
September marked a pivotal turning point for the Bitcoin Cash market, as bulls emerged with a positive bias around the $300 level, driving the market upward. However, the bulls faced the lingering influence of bearish sentiment, which slowed the pace of recovery. Despite this, the market clearly demonstrated a series of higher lows, signaling the emergence of bullish momentum.
In November, the market experienced a significant breakthrough, surpassing the $400 level. Successfully reclaiming this key level triggered a surge in bullish sentiment, propelling the market higher and enabling it to break through another critical resistance at around $450. This move further amplified volatility, creating challenges for the bulls in overcoming the $500 level. The increased market fluctuations have made it difficult for the uptrend to maintain sustained momentum above this price point.
Bitcoin Cash Market Data
- BCH/USD Price Now: $491
- BCH/USD Market Cap: $9.8 billion
- BCH/USD Circulating Supply: 19.8 million
- BCH/USD Total Supply: 19.8 million BCH
- BCH/USD CoinMarketCap Ranking: #15

Key Levels
- Resistance: $500, $550, and $60
- Support: $400, $350, and $300.
The Bitcoin Cash Market Through the Lens of Indicators
Volatility spiked in November when the Bitcoin Cash market surged past the $400 level, triggering a volatility storm. Despite this, the bulls have managed to maintain control, pushing the market to form higher lows as the price approaches the $500 level. Earlier today, the price briefly surpassed $500, but the bulls were unable to sustain the momentum, causing the price to fall back below this level.
The Bollinger Bands, along with the 20-day SMA, indicate support for a bullish bias, as both the standard deviation and the moving average suggest upward potential. The Relative Strength Index (RSI) also points to the possibility of sharp price oscillations, as the RSI line continues to zigzag above the 50 mark.
If the bulls can keep the crypto signal buoyant within the $450 to $500 range, the volatility may subside, paving the way for a brief consolidation period. Following this, the market could resume its upward movement. New bullish investors may consider entering the market around the $450 level, as it offers a potential entry point while the market stabilizes.
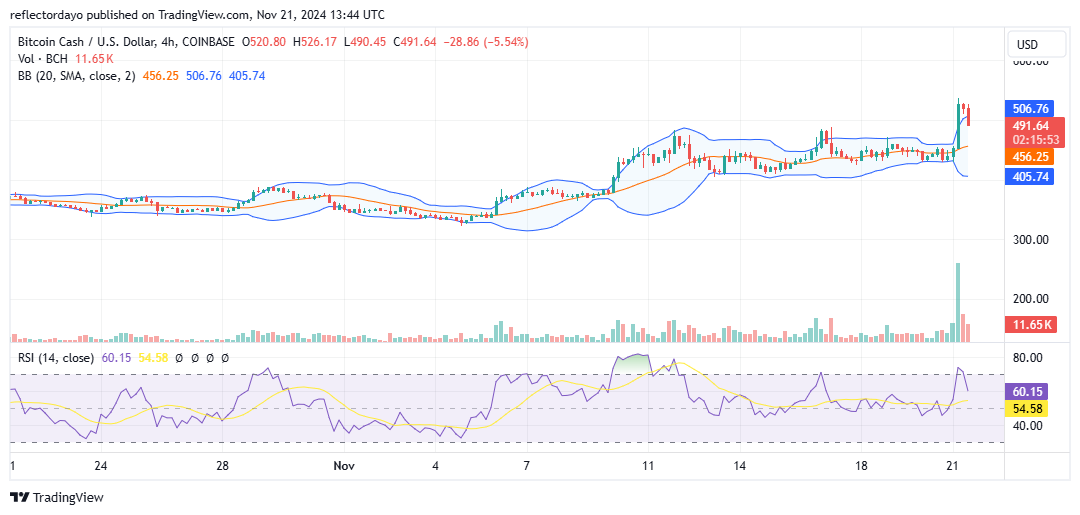
BCH/USD Price Prediction: 4-Hour Chart Analysis
The four-hour chart reveals a more stable market overall, but this morning’s hyper-bullish rally appears to have strengthened bearish sentiment above the $500 level. After the market peaked at $537, a sharp correction followed, causing the bulls to lose their footing at $500. Additionally, early profit-taking by some traders has made it difficult for the bulls to maintain control at this critical level.
The recent candlestick formations suggest that bearish momentum may persist. This outlook is further supported by the Bollinger Bands, which show a broad bandwidth—indicating heightened volatility. Under these conditions, a swift recovery at the $500 level appears unlikely at this time.

