Celestia (TIA/USD) Stabilizes Above Key Support Level After Dipping Below $10.76
Estimated Reading Time: 3 minutes
Don’t invest unless you’re prepared to lose all the money you invest. This is a high-risk investment and you are unlikely to be protected if something goes wrong. Take 2 minutes to learn more
The support level at $10.76 was crucial in driving the price surge towards the key $12.00 mark. It was essential for the Celestia bulls to maintain their position at $10.76 to ensure that the long-standing resistance at $12.00 was broken. However, due to high market volatility, the support level could not be sustained. After the price tested the $12.00 resistance for the second time, a significant bearish move was triggered. The increased volatility allowed the bears to capitalize, preventing the bulls from holding the $10.76 support level.
Celestia Market Data
- TIA/USD Price Now: $9.29
- TIA/USD Market Cap: $1.7 million
- TIA/USD Circulating Supply: 187 million
- TIA/USD Total Supply: 1 billion
- TIA/USD CoinMarketCap Ranking: #56
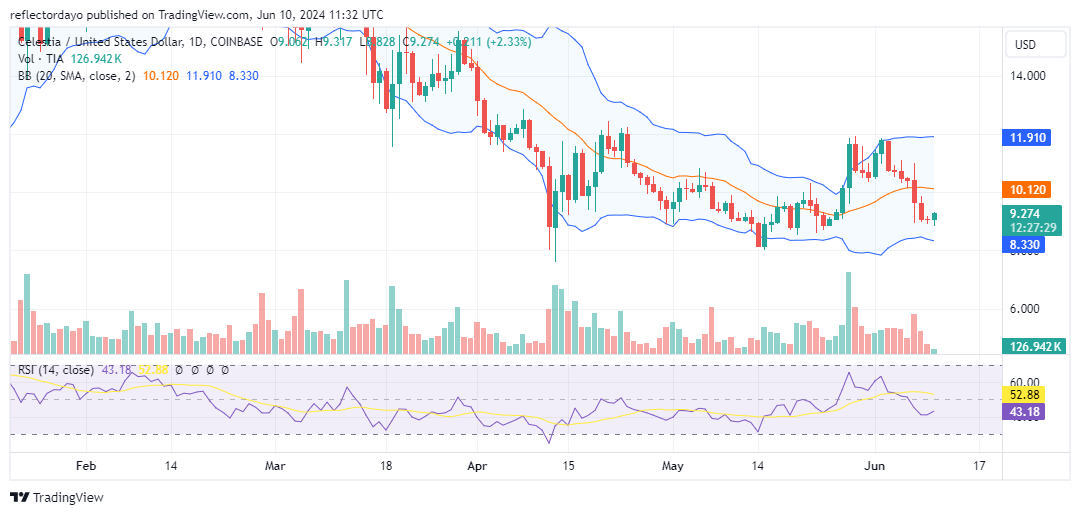
Key Levels
- Resistance: $12.00, $12.50, and $13.00
- Support: $9.00, $8.50, and $8.00.
The Celestia Market Through the Lens of Indicators
The market finally broke down at the key support level on June 5, prompting bulls to shift their focus to the $9.00 threshold as their new entry point. As a result, the price stabilized at this level. The appearance of a plus sign doji in yesterday’s daily trading session suggested to investors and analysts that the market might reverse at this threshold. Today, true to this expectation, the market has made notable bullish advances, with a bullish hammer candlestick signaling growing bullish momentum.
Despite this, the Bollinger Bands indicator is still showing high volatility, likely because market development is still in its early stages. If the volatility remains as high as the Bollinger Bands indicate, the ongoing bullish move should strengthen. If the current bullish momentum persists, the Bollinger Bands may eventually align with the price action.
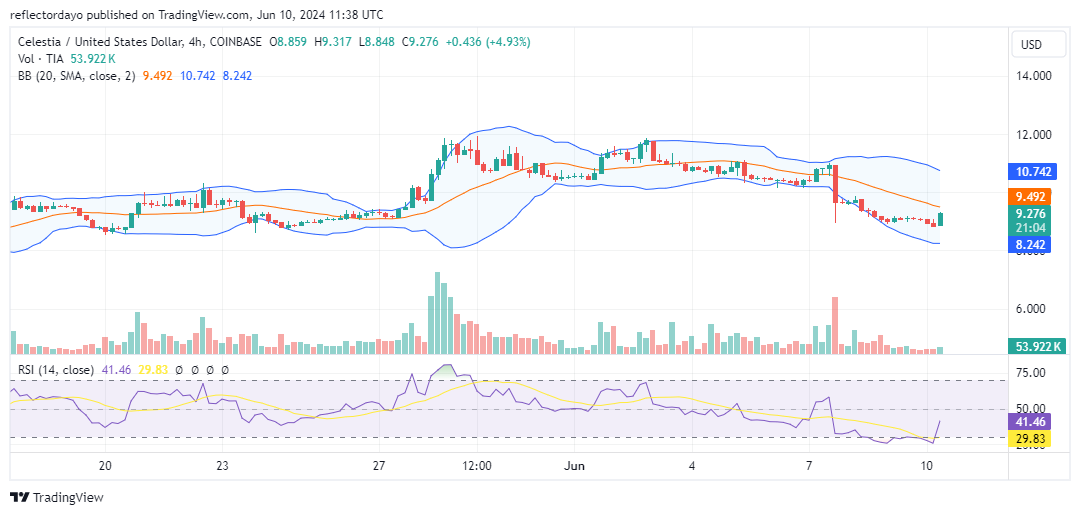
TIA/USD Price Prediction: 4-Hour Chart Analysis
Although the bandwidth of the Bollinger Bands in the 4-hour market outlook remains high, the bands are converging as the current trading session features a strong bullish candlestick. The Relative Strength Index (RSI) also reflects this bullish aggression, with the RSI line showing an almost vertical ascent from the oversold territory to the 41 level. This momentum measurement indicates that bearish momentum is declining. The candlestick patterns suggest that the market has not yet encountered significant resistance, though bears may regroup at the $10.00 price level.