Chainlink (LINKUSD) Finally Breaks the $7.398 Price Level
Estimated Reading Time: 2 minutes
Don’t invest unless you’re prepared to lose all the money you invest. This is a high-risk investment and you are unlikely to be protected if something goes wrong. Take 2 minutes to learn more
As the bull market approached the $7,000 price level, it encountered bearish resistance. The selling pressure was so strong that, coupled with the buying pressure, the volatility increased, and the market experienced indecision for a while. But because the bulls’ are slightly stronger than the bears, the market finally breaks the $7.00 price level. The supply lines are still formidable. And due to this, the resistance level shifted to $7.398. After another period of struggle, the bulls took a strong base at $6.803, taking over the market for today and, once again, breaking the new resistance.
LINK/USD Price Statistic
- LINK/USD price now: $5.79
- LINK/USD market cap: $3,858,231,657
- LINK/USD circulating supply: 507,999,979 LINK
- LINK/USD total supply:1,000,000,000
- LINK/USD coin market cap rank: #21
Key Levels
- Resistance: $8.0, $8.5, $9.0
- Support: $6.5, $6.0, $5.5
Price Prediction for Chainlink: The Indicators’ Point of View
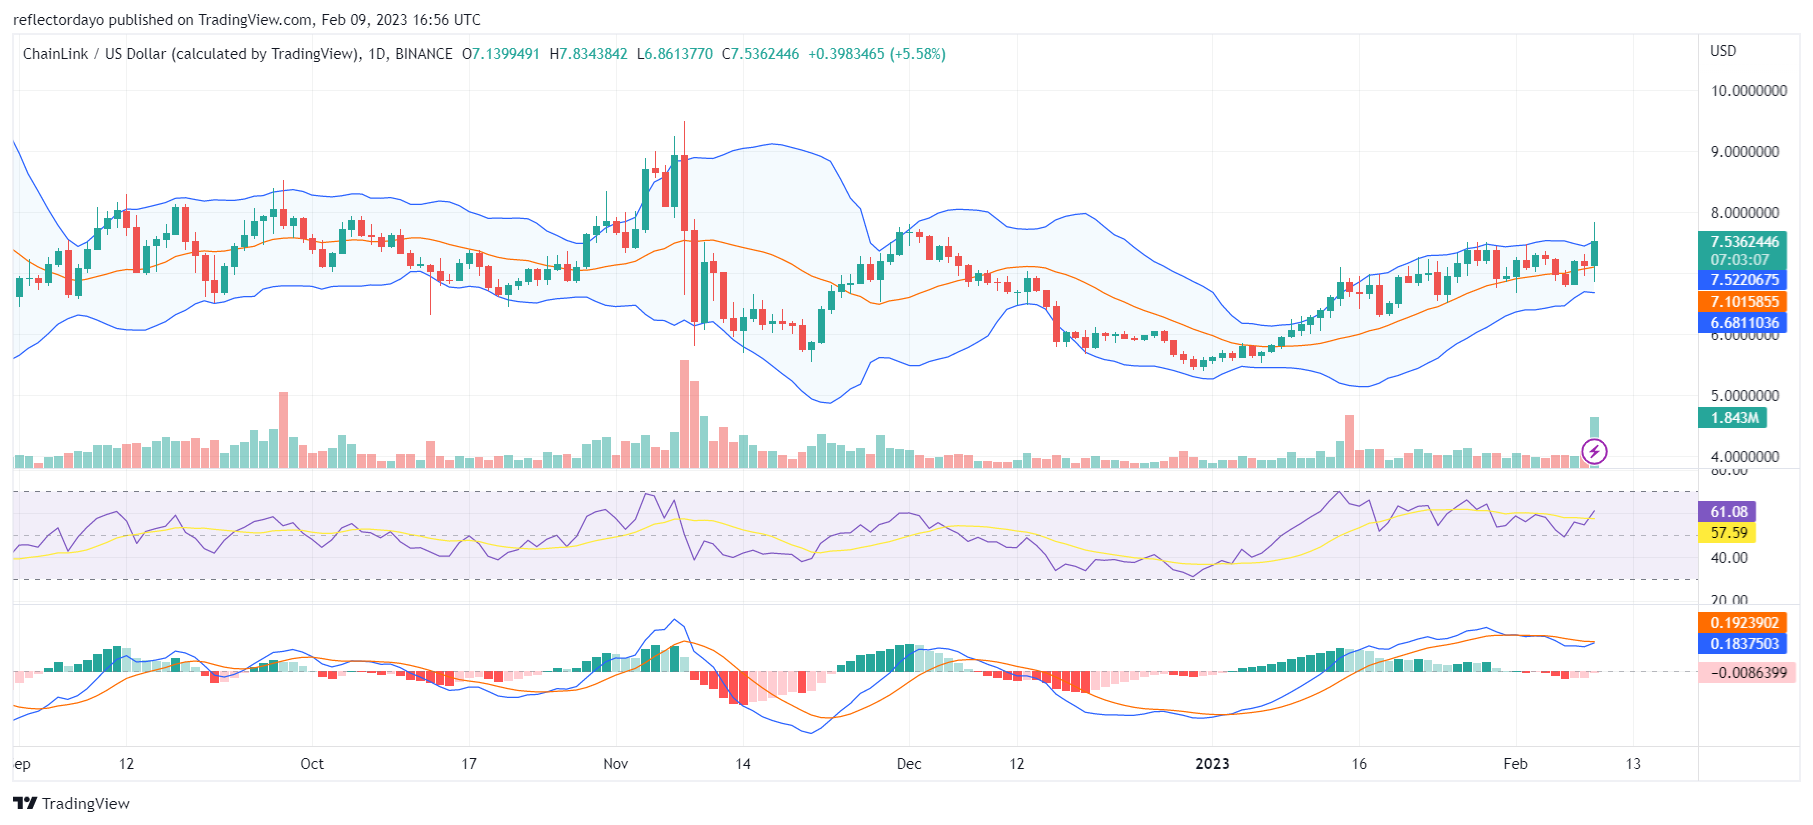
According to the Moving Average Convergence and Divergence indicator, the fast line just crossed the slow line above the zero level. This illustrates a very swift price recovery after the bull market faced a significant price rejection at the resistance level. For now, buyers are still having the upper hand, but the volatility is increasing. The selling pressure is catching up with the buying pressure. After finally breaking through the key resistance, the bull market now needs to establish another higher support level to encourage the price to move higher.
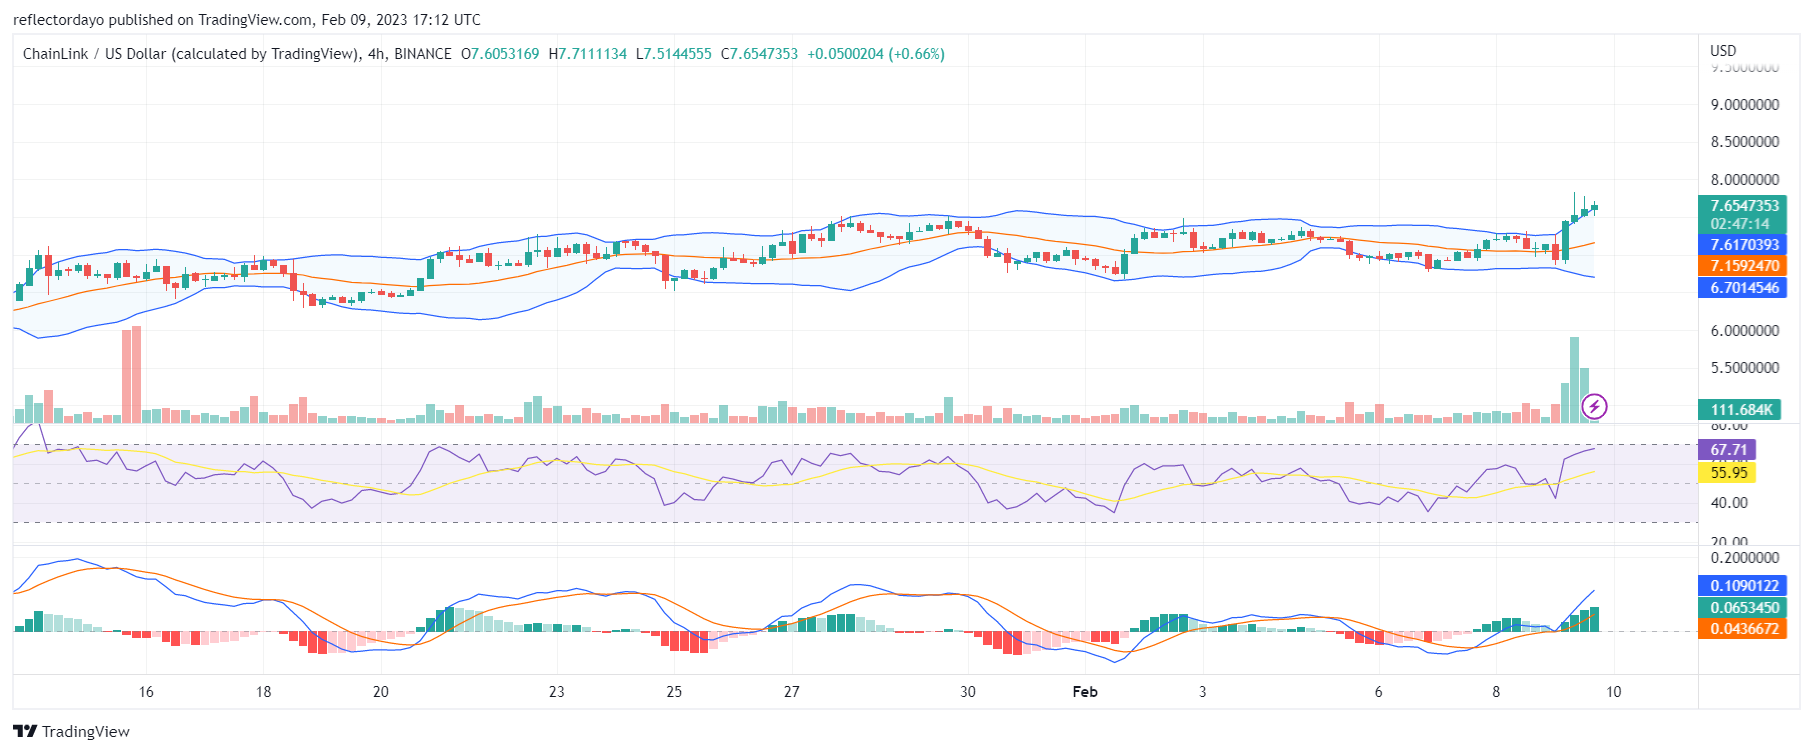
LINK/USD 4-Hour Chart Outlook: The Market finally breaks the resistance
Looking at the market through the Bollinger bands indicator, we can see that the bullish momentum is reducing as the market nears the $8.00 price level. The price action is outside the band. This means that the market is in the overbought territory. Because of this, either a price retracement or a price reversal is imminent. The deviant lower band of the indicator reflects the activities of the bears. For now, the bull market needs a higher support level.