Dogecoin’s Price Pumps Furiously
Estimated Reading Time: 3 minutes
Don’t invest unless you’re prepared to lose all the money you invest. This is a high-risk investment and you are unlikely to be protected if something goes wrong. Take 2 minutes to learn more
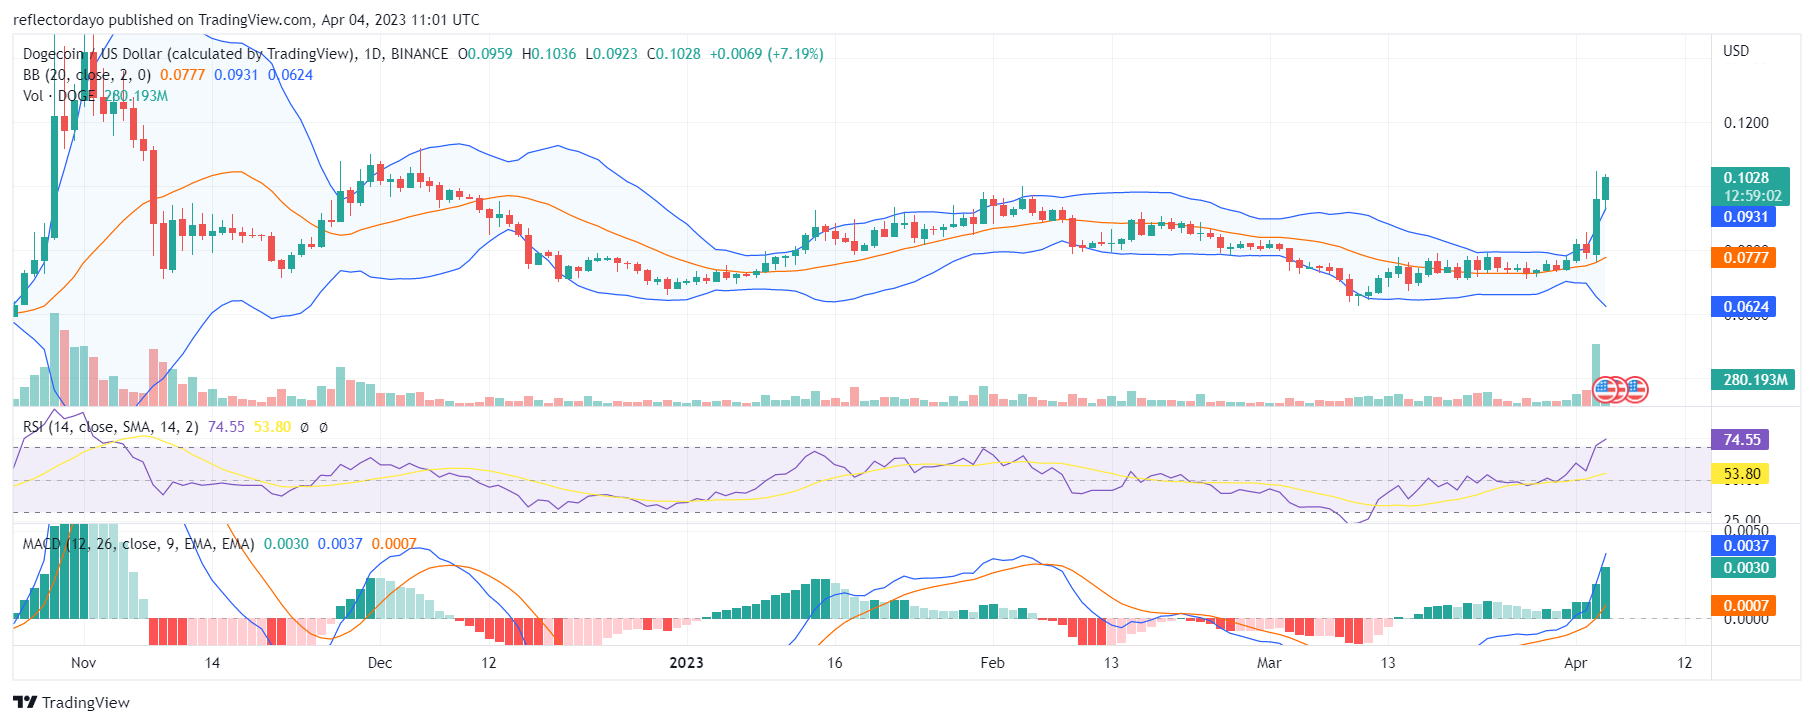
The Dogecoin market was sliding into a downtrend gradually until the bulls found a strong footing at the $0.0662 price level on March 10 and the bearish trend was aborted. However, the buying pressure was not strong enough to turn the market to the upside; instead, the bulls settled for price consolidation on March 14, as the demand force got even with the supply force. The price continued at equilibrium for the rest of March. This prolonged indecision could be the result of low volume and a weak trend in the market.
DOGE/USD Price Statistics
- DOGE/USD Price Now: $0.1007
- DOGE/USD Market Cap: $14,004,343,334
- DOGE/USD Circulating Supply: 138,798,436,384 DOGE
- DOGE/USD Total Supply: 138,798,436,384.
- DOGE/USD CoinMarketCap Ranking: #7
Key Levels
- Resistance: $0.11, $0.12, and $0.13
- Support: $0.80, $0.70, and $0.60.
Price Prediction for Dogecoin: The Indicators’ Point of View
The hyper-bullish move of the Dogecoin market between today and yesterday has brought the price to $0.1010, which is around the climax of the bull market on December 1 of last year before the bears took over. The bull market got close to this same resistance level on February 4 before yielding to the selling pressure. But this time around, the bullish price was not gradual; rather, it was sharp and aggressive, indicating massive buying within a period of two daily trading sessions. These bullish activities caused the Bollinger Bands indicator to have a strong divergence between the standard deviation lines. The upper band of the indicator, however, has more movement than the lower band. This indicates that the bulls are more aggressive than the bears.
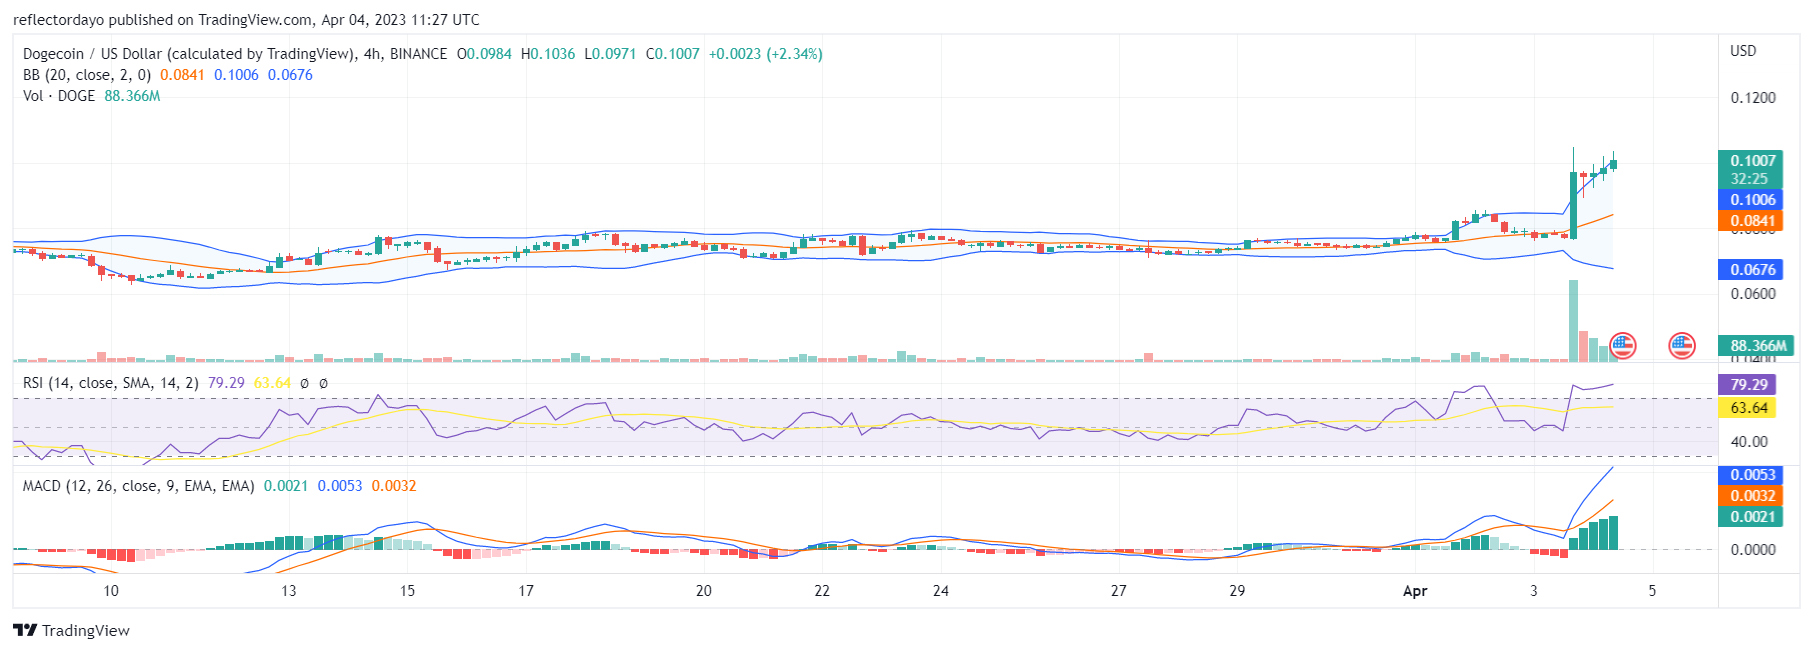
DOGE/USD 4-Hour Chart Outlook:
Due to some reasons, traders are ready to keep buying even at the resistance price of $0.1010, while some traders are willing to take their profit at this price level. That is why the market seems to be pegged around $0.1010. From the 4-hour session outlook on the market, we see the price continuously pulling back after hitting the threshold of the $0.100 price level. Due to the low-volume nature of the market, the bulls need to settle above the $0.100 price level by establishing a strong support level there. This will encourage the continuation of the bullish trend.