dYdX (DYDX) Bounces Back After a Massive Defeat at the $3.28 Price Level
Estimated Reading Time: 2 minutes
Don’t invest unless you’re prepared to lose all the money you invest. This is a high-risk investment and you are unlikely to be protected if something goes wrong. Take 2 minutes to learn more
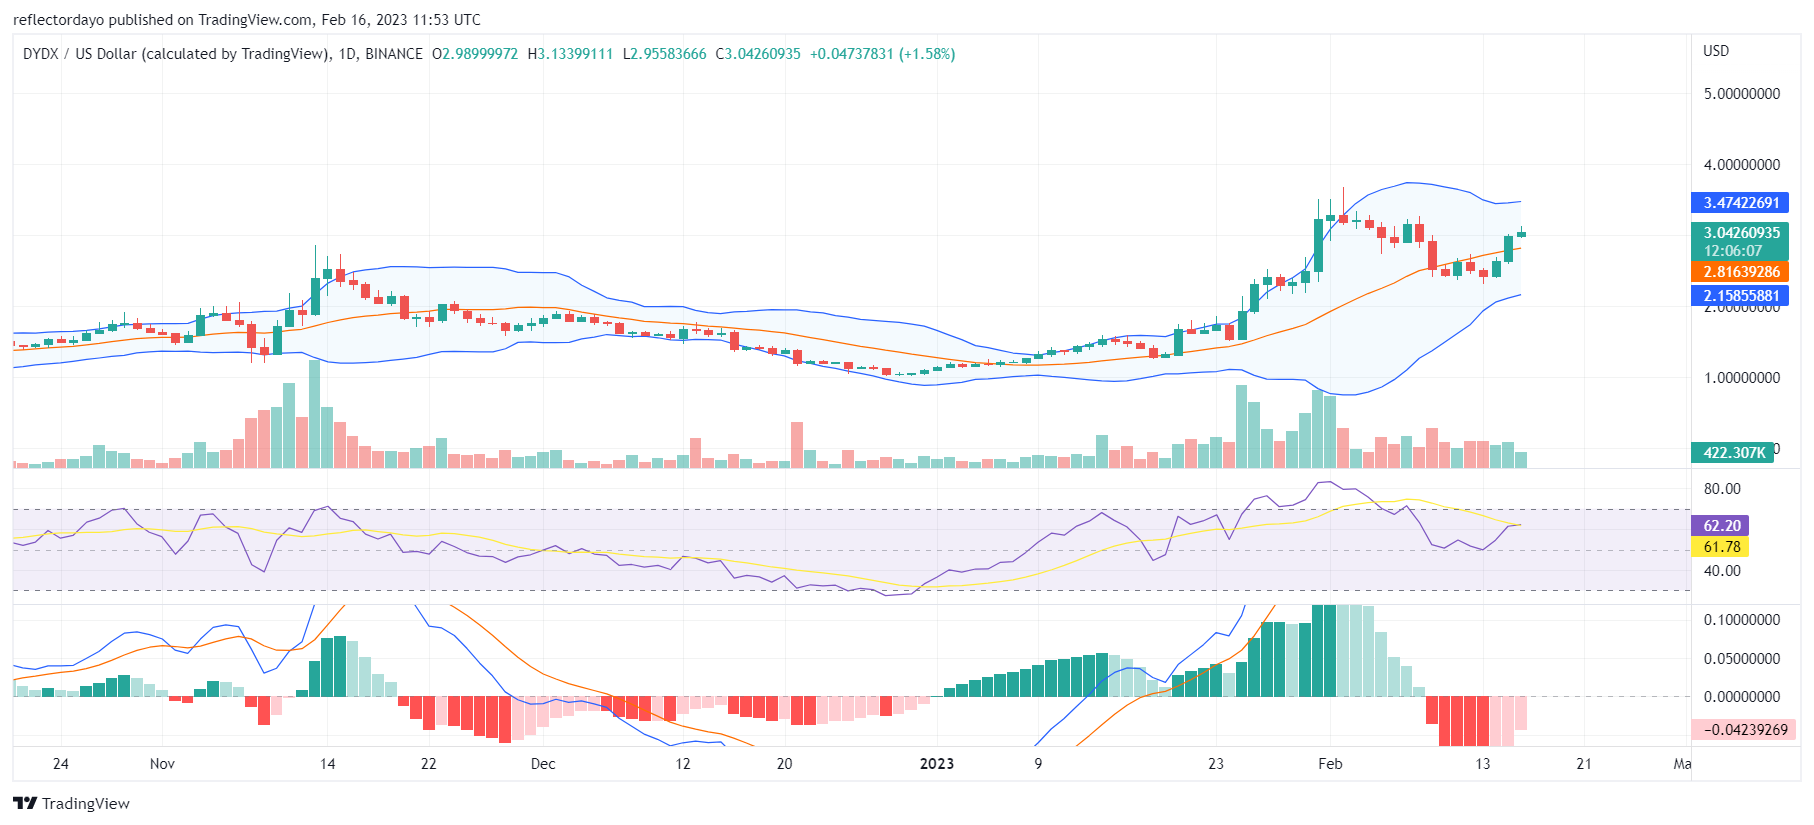
DYDXUSD’s bullish trend was cut short sharply at the $3.28 resistance level. Before the brief downturn of the market on January 31, the bullish move for the day’s trading session was very significant. However, the bands of the Bollinger Indicator for that day expanded greatly, pointing to the fact that the bears are also gathering momentum at around the resistance level. The clash between the two market forces resulted in indecision, though with erratic price characteristics as the bullish price bounces back.
DYDX/USD Price Statistic
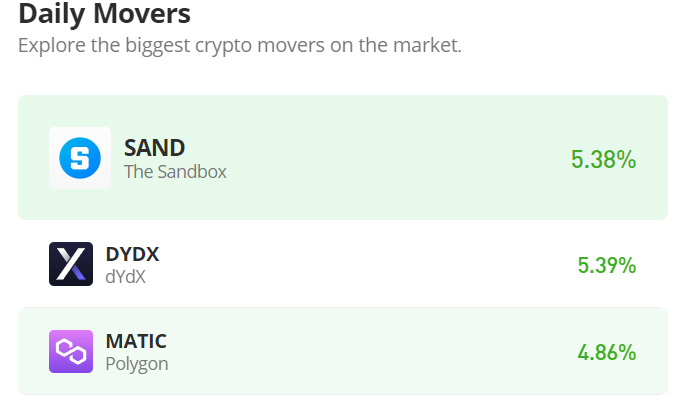
- DYDX/USD price now: 3.04
- DYDX/USD market cap: $473,821,045
- DYDX/USD circulating supply: 156,256,174 DYDX
- DYDX/USD total supply: 1,000,000,000
- DYDX/USD coin market cap rank: #90
Key Levels
- Resistance: $4.00, $4.50, $5.00
- Support: $2.00, $1.50, $1.00
Price Prediction for dYdX: The Indicators’ Point of View
The price reversal attempt failed as the bulls secured a strong position at the $2.4 price level. This bullish stronghold continues to hold for five days until exhaustion set in for the bears. Then the dYdX bull market bounced back, reclaiming the $3.00 price level. Yet again, the buyers need to face the resistance again at the $3.28 price level. The two standard deviations of the Bollinger bands indicator are contracting as forces match each other at the key resistance level. The momentum of the bull market is also on a decline as it approaches the key resistance level.
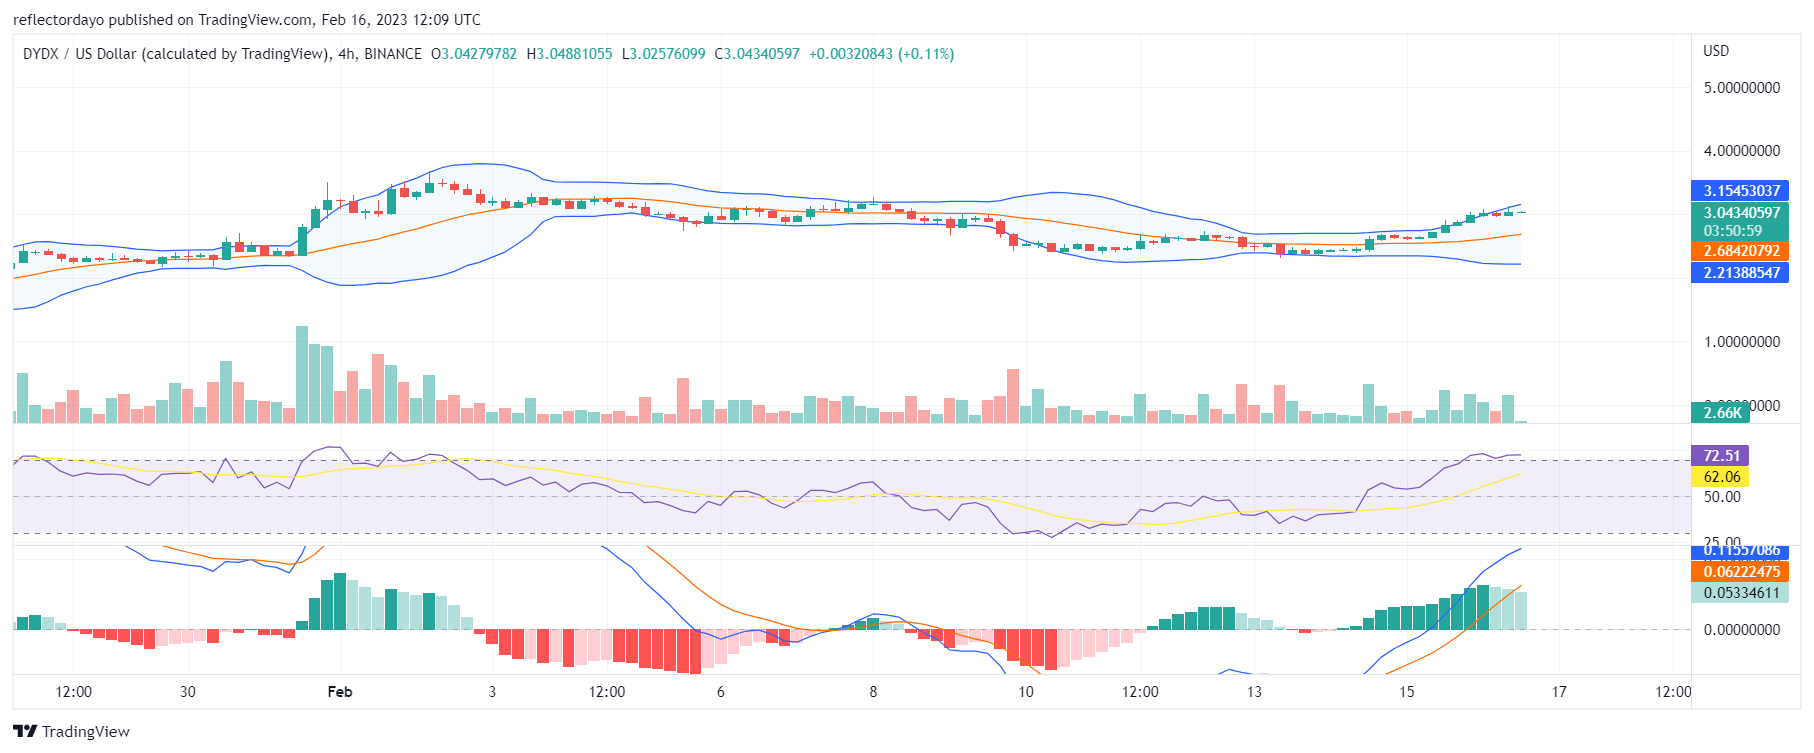
DYDX/USD 4-Hour Chart Outlook: The Bull Market Bounces Back
The view of the market from a 4-hour point of view suggests that the bullish price may get rejected again at the same $3.28 price level. We can see the price action performing along the edge of the ascending standard deviation curve of the Bollinger bands indicator, but the lower curve is moving in the opposite direction. This reflects the activities of the seller around the key resistance level. However, if the buyers can maintain their position at this level in the market, the uptrend may continue.