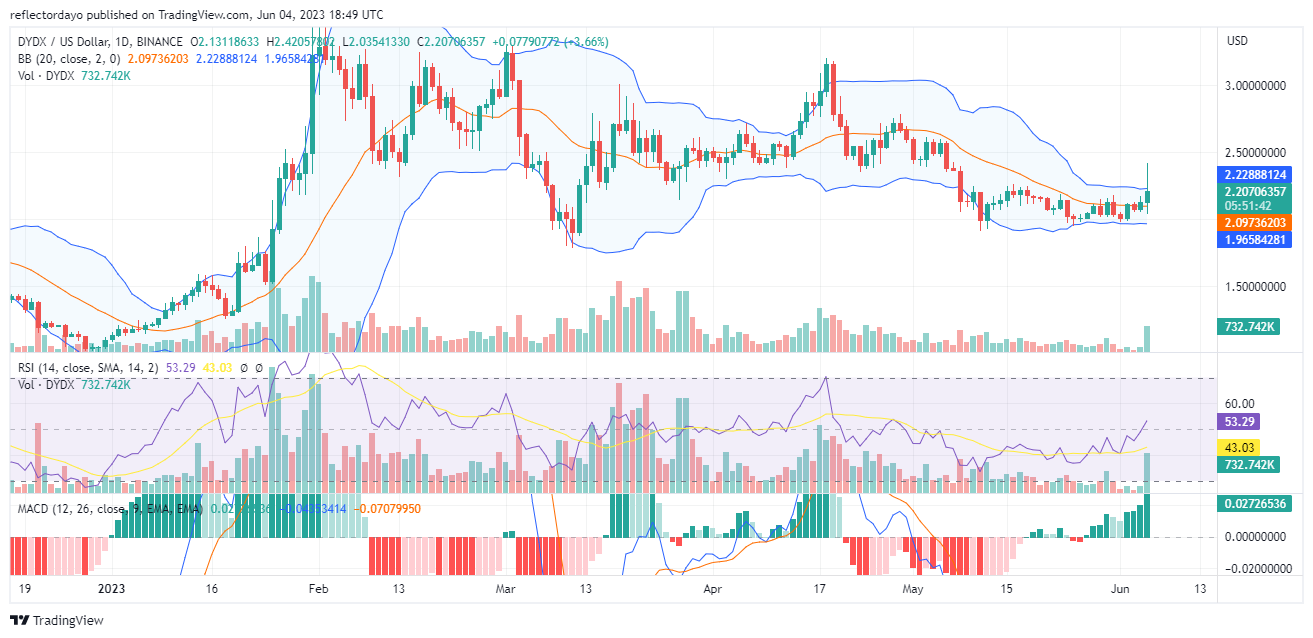
dYdX (DYDX/USD) May Likely Continue the Bullish Trend
Estimated Reading Time: 2 minutes
Don’t invest unless you’re prepared to lose all the money you invest. This is a high-risk investment and you are unlikely to be protected if something goes wrong. Take 2 minutes to learn more
As the dYdX market encountered the $2.15 resistance level, the bulls became more aggressive, and they tested above the price level repeatedly. However, the market remains pegged at the resistance as bearish sentiment at the $2.15 price level keeps cutting short the bullish advances. Due to the dYdX’s bullish resilience at the resistance price level, the barrier is likely to be broken soon.
DYDX Market Data
- DYDX/USD Price Now: $2.02
- DYDX/USD Market Cap: $316,540,00
- DYDX/USD Circulating Supply: 156,260,000 DYDX
- DYDX/USD Total Supply: 160,000,000
- DYDX/USD Coinmarketcap Ranking: #104
Key Levels
- Resistance: $2.20, $2.25, $2.30
- Support: $1.95, $1.90, and $1.85.
Price Prediction for dYdX: The Indicators’ Point of View:
Looking at the market from the perspective of the Bollinger Bands indicator, it is very likely that the market will continue the dYdX bullish trend, though it is currently being pegged around the $2.134 resistance level. One reason why we can expect bullish action at the current level is because the upper standard deviation of the Bollinger indicator could not respond to the series of recent brief bullish runs within the past few days.
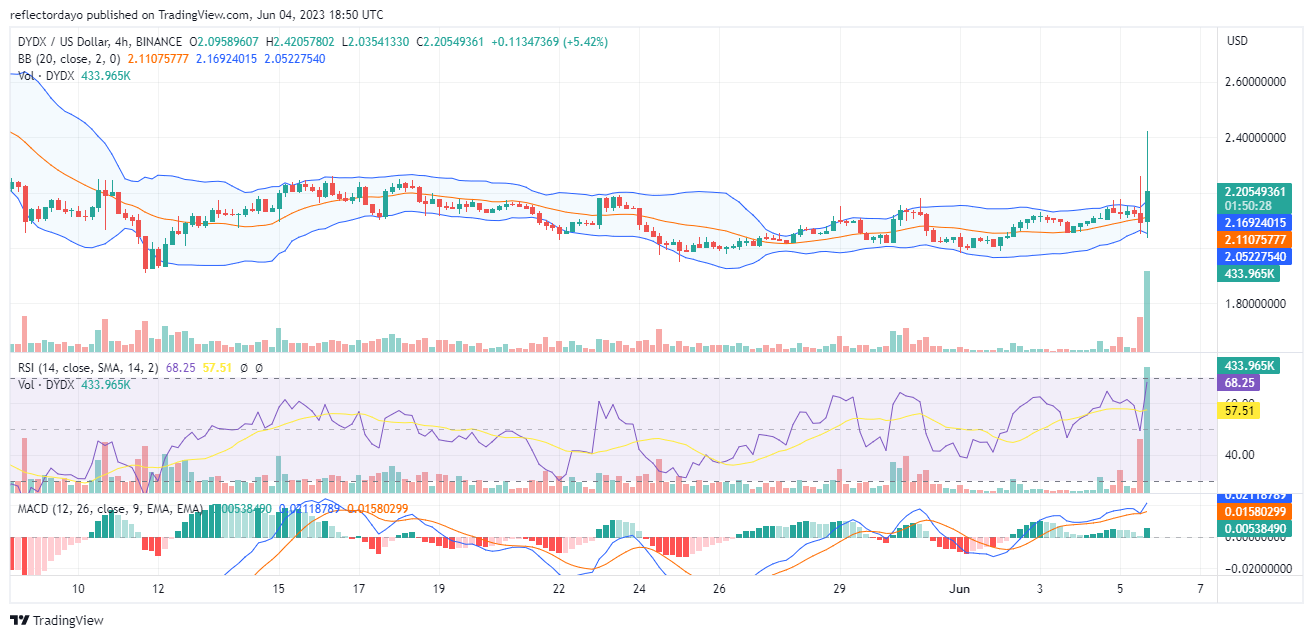
DYDX/USD 4-Hour Chart Outlook:
From a 4-hour outlook on the market, the Bollinger Bands indicator is also not responding to the brief bullish activities in the past few days. Since there have been several bullish attempts to break through this resistance level, we suspected that the bullish trend may continue. However, considering the market from a different perspective, this market behavior may be a sign of bullish exhaustion. Therefore, instead of the continuation of the bullish trend, we could expect a brief price consolidation or mini-trend reversal.