Ethereum Classic (ETC/USD) Consolidates at $27: What Lies Ahead?
Estimated Reading Time: 3 minutes
Don’t invest unless you’re prepared to lose all the money you invest. This is a high-risk investment and you are unlikely to be protected if something goes wrong. Take 2 minutes to learn more

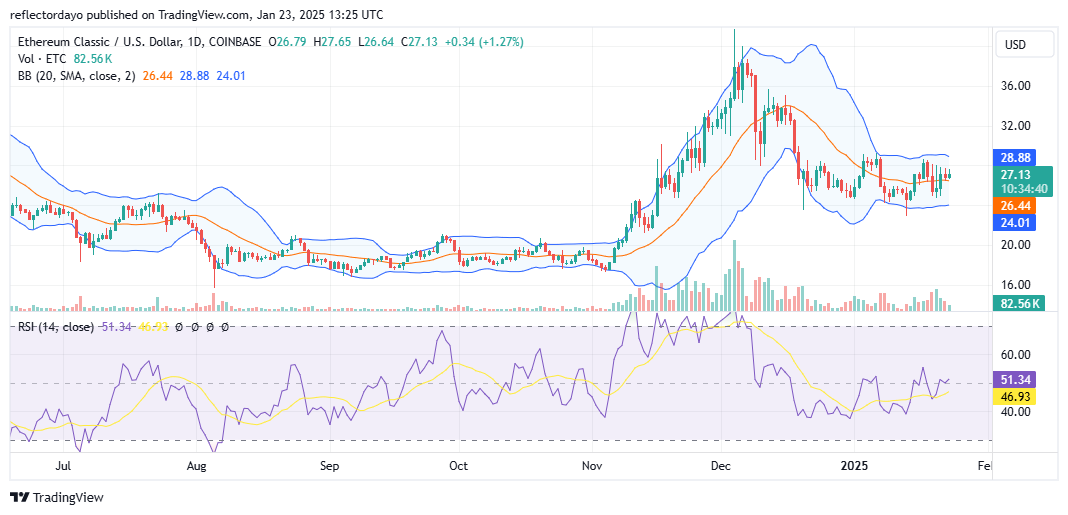
Following a remarkable bull run that commenced in early November last year from approximately $18, Ethereum Classic (ETC/USD) experienced a significant price surge, culminating in a peak above $41 in early December. This rapid price appreciation triggered profit-taking activity, leading to a sharp bearish correction.
The intense selling pressure initially found support near the $28 price level on December 19th. However, the bearish momentum remained strong, forcing the price to retreat below this critical support. Since then, the market has entered a period of consolidation, trading sideways around the $27 price level.
Ethereum Classic Market Data
- ETC/USD Price Now: $27.12
- ETC/USD Market Cap: $4.09 billion
- ETC/USD Circulating Supply: 150 million ETC
- ETC/USD Total Supply: 210.7 million ETC
- ETC/USD CoinMarketCap Ranking: #34
Key Levels
- Resistance: $28, $32, and $36
- Support: $24, $23, and $20.
The Ethereum Classic Market Through the Lens of Indicators
In December, the Ethereum Classic market experienced heightened volatility, with strong bullish pressure initially emerging. However, bearish forces ultimately maintained dominance. Towards the end of the month, bulls began to stabilize the price, establishing a firmer foothold around the $28 and $27 price levels. As bullish strength gradually increased, the crypto signal entered a period of consolidation that has persisted since then.
Currently, a potential shift in market dynamics may be emerging. There are indications of a convergence between demand and supply forces around the $27 price level. Recent 4-hour candlestick patterns exhibit lower highs, suggesting a weakening of upward momentum. Simultaneously, higher lows are forming on the downside, indicating growing buying pressure. This confluence of factors suggests a potential equilibrium point at $27.
A period of increased volatility may precede a potential price breakout. However, if this volatility squeeze fails to occur, the consolidation phase could persist, further solidifying the $27 level as a key support or resistance area.
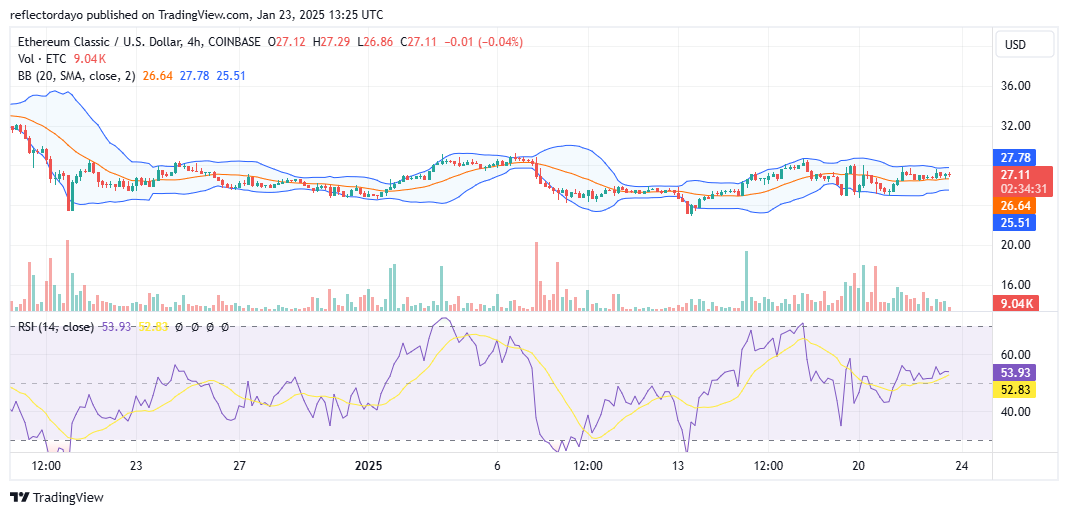
ETC/USD Price Prediction: 4-Hour Chart Analysis
Analyzing volume indicators on a shorter timeframe reveals a decline in trading activity, suggesting diminishing market confidence and potential indecision among participants. This prolonged convergence may culminate in a period of heightened volatility preceding a significant price movement.
Currently, the market exhibits a slight bullish bias. The Bollinger Bands suggest a slight bullish advantage, and the Relative Strength Index (RSI) currently measures 54, indicating moderate bullish momentum. Investors should closely monitor the market for potential developments.