Ethereum Name Service (ENS/USD) Breaks New High Price Levels
Estimated Reading Time: 2 minutes
Don’t invest unless you’re prepared to lose all the money you invest. This is a high-risk investment and you are unlikely to be protected if something goes wrong. Take 2 minutes to learn more
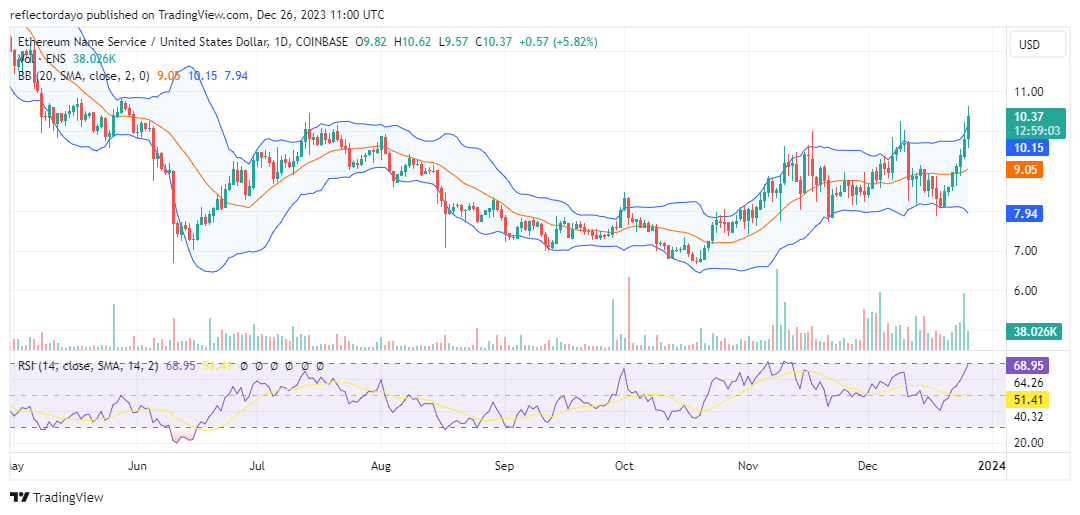
Since the Ethereum Name Service reached a peak of $10.45 in mid-July, the market has gradually stabilized above the $7.00 price level. Following a period during which bearish sentiment waned and consolidated, bullish activity emerged just below the $7.00 mark. Subsequently, the market shifted upward, trading in a range between $8.00 and $9.82.
Ethereum Name Service Market Data
- ENS/USD Price Now: $10.58
- ENS/USD Market Cap: $322,603,929
- ENS/USD Circulating Supply: 30,367,405 ENS
- ENS/USD Total Supply: 100,000,000 ENS
- ENS/USD CoinMarketCap Ranking: #162
Key Levels
- Resistance: $11.50, $12.00, and $12.50.
- Support: $7.50, $7.00, and $6.50.
Ethereum Name Service Market Forecast: Analyzing the Indicators
Previously, the Ethereum Name Service bull market tested the pivotal resistance level of $10.02 on two occasions prior to today’s breakout. The recent bullish momentum has propelled prices above the critical $10.00 threshold, pushing bearish sentiment towards $10.63.
However, there exists a divergence between the price action, which indicates a successful breach of the resistance, and today’s trading volume histogram. This discrepancy between the candlestick pattern and the volume histogram suggests that the current bullish momentum may not be sustainable. Nonetheless, traders should remain vigilant. If bulls manage to maintain support above $10.00 in the upcoming trading sessions, it could signal a shift in the market dynamics towards a sustained bullish trend.
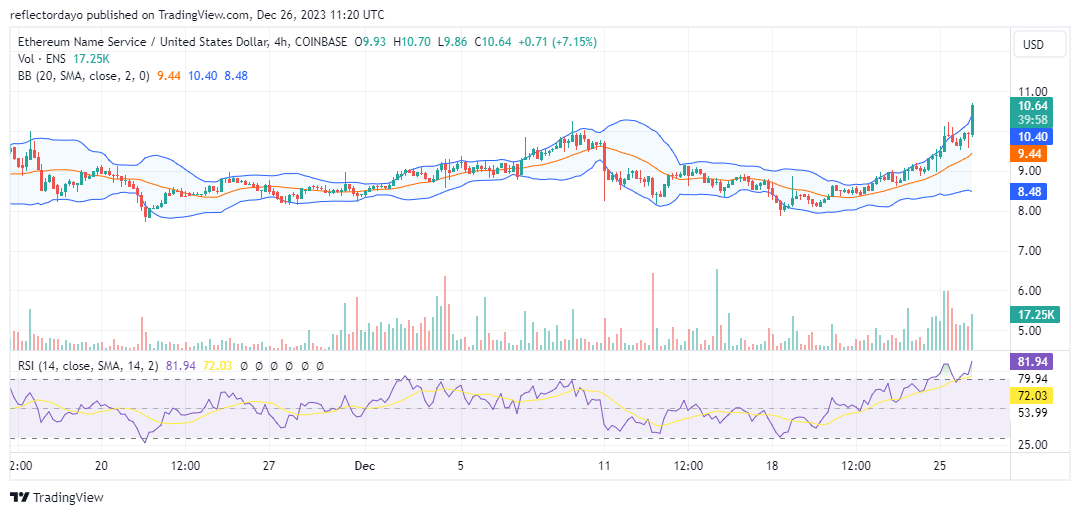
ENS/USD 4-Hour Chart Outlook
From our analysis of the market, it is evident that bulls are gaining significant upward momentum, resulting in the upper standard deviation curve of the Bollinger Bands diverging more than the lower curve. Nevertheless, the bearish resistance near the $10.00 price level has limited the responsiveness of the lower Bollinger Band curve to the upward price movement. Upon examining the 4-hour chart, the volume indicator histogram for the current trading session demonstrates an increasing trend. This suggests a growing influx of traders participating in the bull market.