Fantom (FTM/USD) Bulls Regain Control, Price Surges Past $0.8
Estimated Reading Time: 2 minutes
Don’t invest unless you’re prepared to lose all the money you invest. This is a high-risk investment and you are unlikely to be protected if something goes wrong. Take 2 minutes to learn more

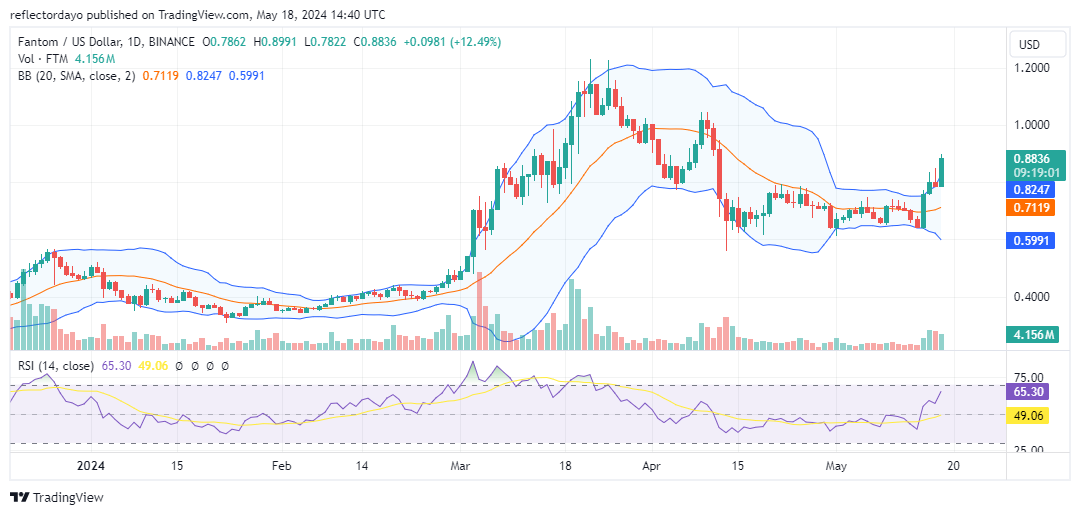
The $0.80 price level previously served as a support level for the Fantom market until it was breached in April, becoming a resistance point since then. Traders established a new support level at $0.64, but the strong presence of bears at $0.80 caused the price to move sideways. On May 15, the bulls began to muster strength to challenge the bears’ dominance at the $0.80 level. Today, it appears the bulls have regained control of this level.
Fantom Market Data
- FTM/USD Price Now: $0.88
- FTM/USD Market Cap: $2.5 billion
- FTM/USD Circulating Supply: 2.8 billion
- FTM/USD Total Supply: 3.2 billion
- FTM/USD CoinMarketCap Ranking: #48
Key Levels
- Resistance: $5.00, $5.50, and $6.00
- Support: $3.50, $3.00, and $2.50.
Fantom Market Through the Lens of Indicators
Today’s trading activities exhibit a strong bullish outlook with minimal bearish resistance, as indicated by the small upper shadow on the bullish candlestick. This suggests traders are more inclined to buy than sell. Over the past two days, bears have shown a strong presence at this level, as evident from the previous rejections.
Notably, the volume of trade indicator has shown significant increases in the height histograms over the past few days, culminating in a market breakout today. Fantom‘s bullish traders are successfully maintaining the price at this elevated level. The Relative Strength Index (RSI) also signals a strong buy, with the RSI line measuring momentum at 65.4. According to this crypto signal, should there be any retracement, bulls are likely to hold $0.80 as a support level.
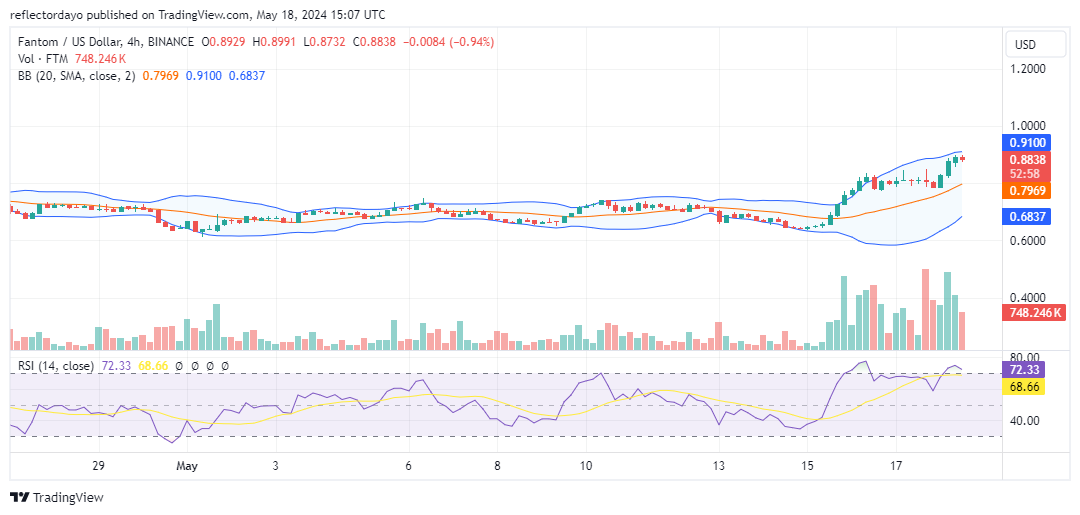
FTM/USD Price Prediction: 4-Hour Chart Analysis
The 4-hour chart reveals the formation of resistance around the $0.89 price level, where demand is meeting supply, creating equilibrium. This development, at the peak of an uptrend, raises concerns about a potential price reversal. The Relative Strength Index (RSI) indicates that the market might be preparing for a correction. However, if the standoff between bulls and bears continues, the market may consolidate around this level, potentially establishing a new support or resistance point.