Hedera Hashgraph (HBARUSD) Bear Market Hits a Brick Wall at $0.057
Estimated Reading Time: 2 minutes
Don’t invest unless you’re prepared to lose all the money you invest. This is a high-risk investment and you are unlikely to be protected if something goes wrong. Take 2 minutes to learn more
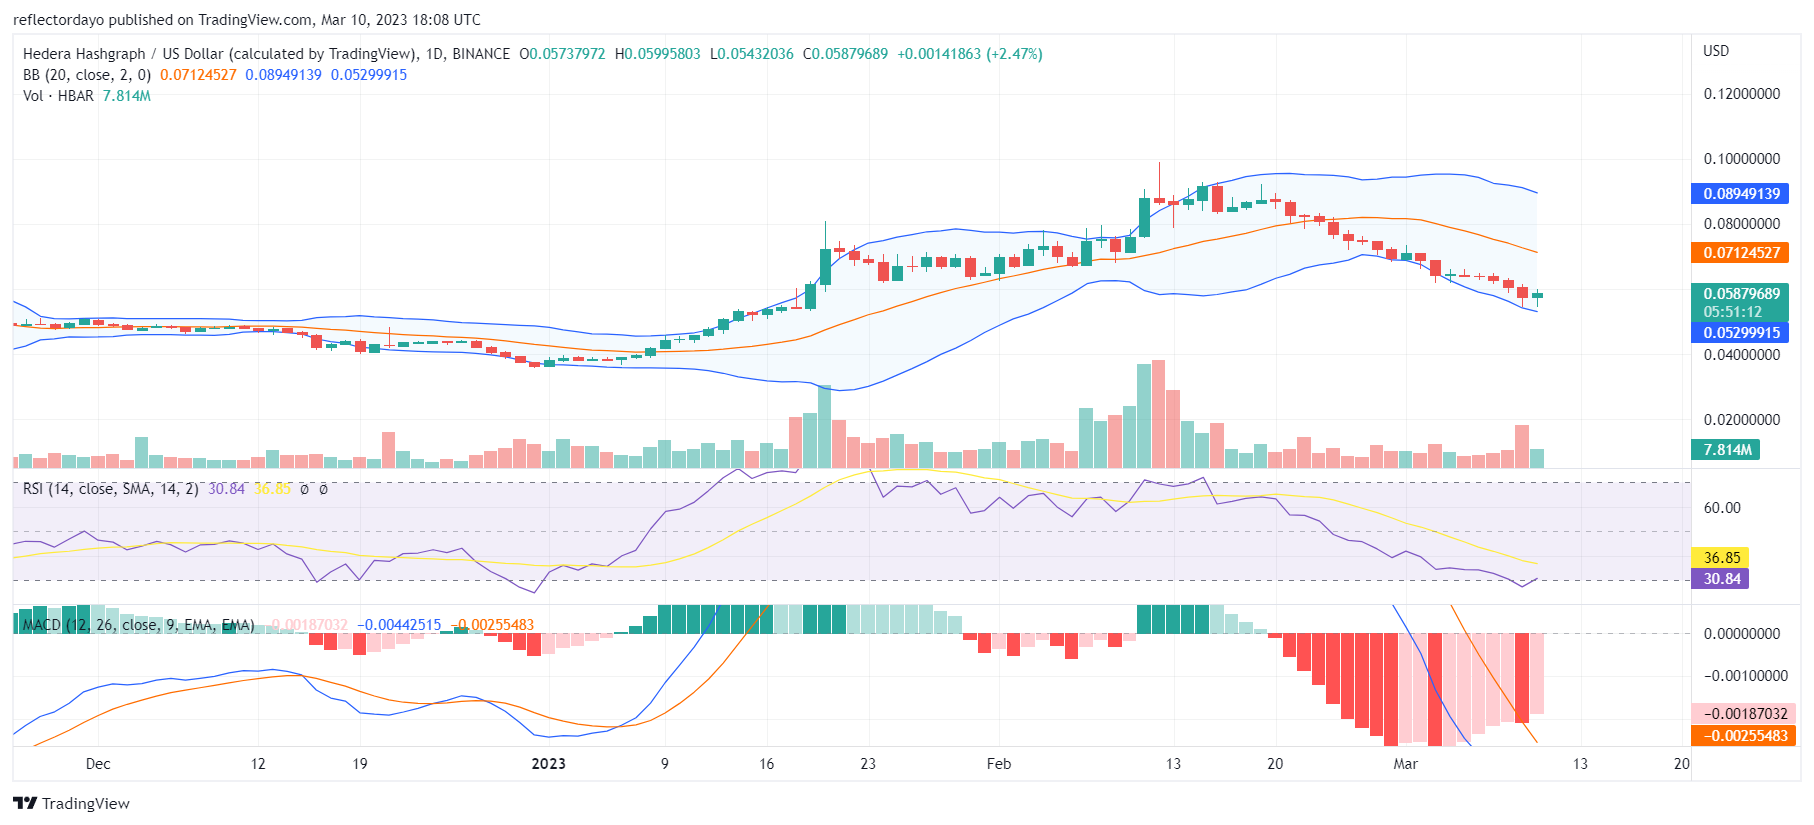
In mid-February, the Hedera Hashgraph bull market had previously hit a brick wall at the $0.089 price level. Although the bull market still has much of its propelling force, it eventually had to succumb to the pressure coming from the main supply line. After a few days of indecision, on February 20, the market began a slow decline. The bulls are still strong, and that is why we see the appearance of Dojis on the chart. However, because the bears are stronger, the market has to go the bearish way
HBAR/USD Price Statistics
• HBAR/USD price now: $0.0589
• HBAR/USD market cap: $1,647,408,279
• HBAR/USD circulating supply: 28,078,985,417 HBAR
• HBAR/USD total supply: 50,000,000,000
• HBAR/USD coin market cap rank: #32
Key Levels
• Resistance: $0.06, $0.07, and $0.08
• Support: $0.04, $0.03, and $0.02
Price Prediction Hedera Hashgraph: The Indicators’ Point of View: A Slow-Declining Market
Even after the market crossed below the 20-day moving average curve on February 24, the Bollinger Bands still maintain a horizontal movement. This is because market control is well contended for by both demand and supply. However, in the few days that followed, as the bulls lost more ground to the bears, the bands portray a down-trending price channel. As a pointer to the fact that the demand zone is still formidable, the bands are still significantly divergent.

HBAR/USD 4-Hour Chart Outlook: Price Bounces Back From $0.056
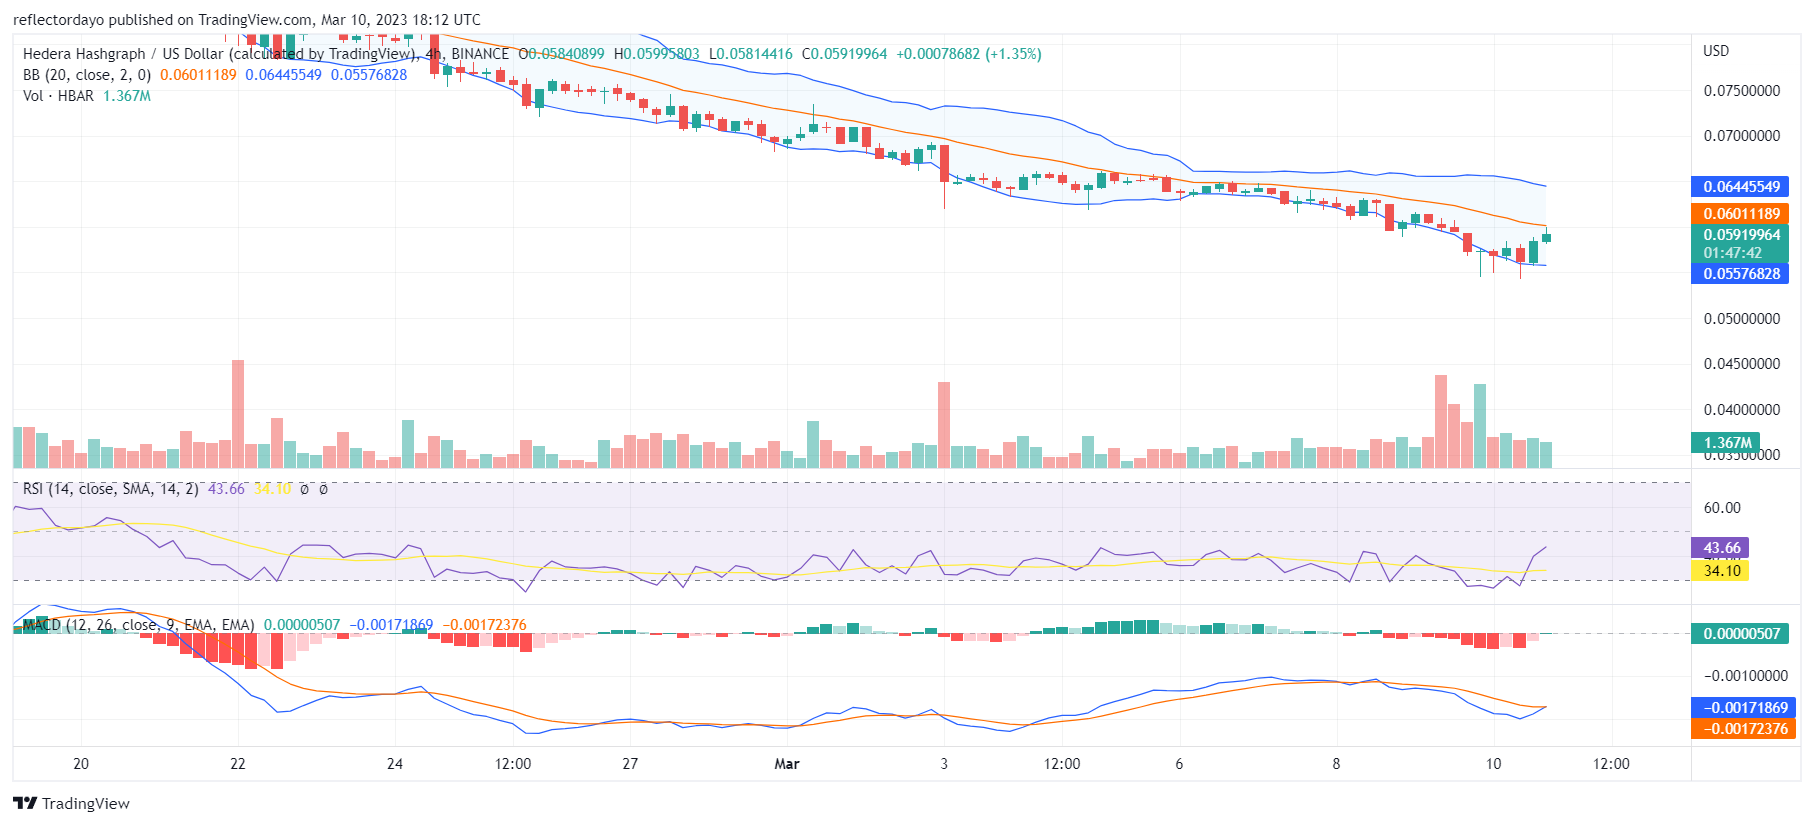
At around $0.056, we see the bull market bouncing back for action. However, as the market approached the major level of $0.06, we noticed the bullish price rebounding due to the bearish resistance at that level. Even in the Relative Strength Index (RSI), we noticed the RSI line slowing down from its upward rally, but still measuring at level 43, which is still in the sell zone. If the bulls can break the resistance at the $0.06 price level, they will finally turn the market around.
Buy Hedera Hashgraph on Etoro