Hedera Hashgraph (HBARUSD) May Be Initiating a New Bullish Cycle at the Historic Level of $0.046
Estimated Reading Time: 3 minutes
Don’t invest unless you’re prepared to lose all the money you invest. This is a high-risk investment and you are unlikely to be protected if something goes wrong. Take 2 minutes to learn more
On July 6th, the price level of $0.046 held a pivotal significance within the Hedera Hashgraph market dynamics. During this period, bullish sentiment united around this price point, fueling an upward trajectory. Subsequently, the market reached a zenith at $0.062 on July 20th, prompting some traders to capitalize on this upswing, resulting in a temporary retracement.
However, the bullish momentum was effectively sustained, primarily owing to the establishment of a robust support level at $0.052. This critical level acted as a stabilizing factor, ensuring the continuation of the upward trajectory. In mid-August, the market experienced another substantial upsurge, culminating in a peak surpassing the $0.07 price threshold.
HBAR Market Data
- HBAR/USD Price Now: $0.052
- HBAR/USD Market Cap: $1,695,883,312
- HBAR/USD Circulating Supply: 33,207,534,182 HBAR
- HBAR/USD Total Supply: 50,000,000,000 HBAR
- HBAR/USD CoinMarketCap Ranking: #30
Key Levels
- Resistance: $0.058, $0.06, and $0.065.
- Support: $.00, $1.50, and $1.15.
Price Prediction for Hedera Hashgraph: The Indicators’ Point of View
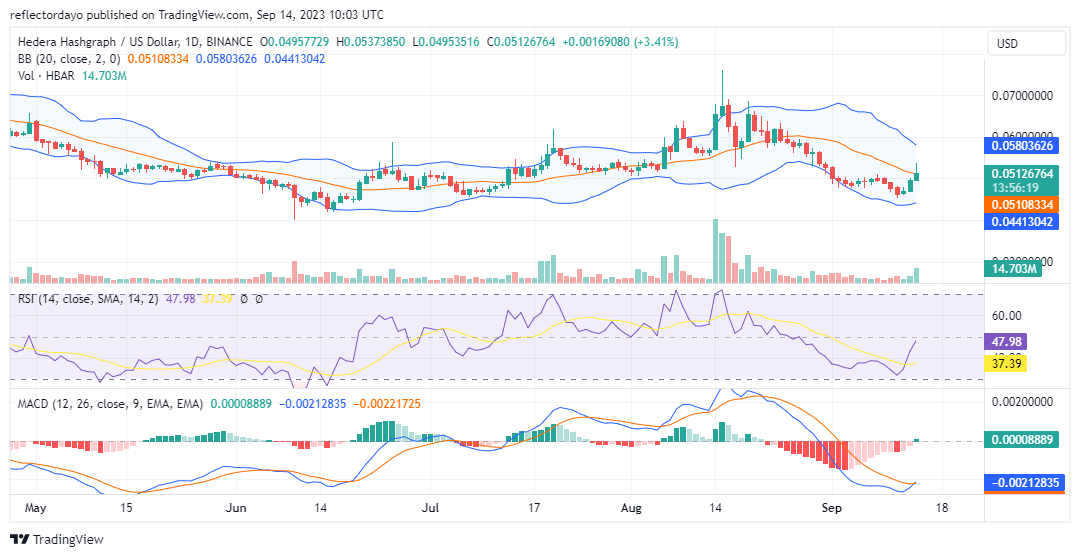
In mid-August, the Hedera Hashgraph market witnessed a substantial increase in trading volume, which played a pivotal role in propelling the market to a peak of $0.0759. As the month drew to a close, market volatility subsided, albeit at the cost of bullish control over the newly established support level at $0.052. Consequently, the market gravitated towards the critical level of $0.046, which represents the final bastion of defense for the bulls.
Approaching this pivotal price point, the market exhibited signs of a turnaround, suggestive of a shifting market dynamic. Key technical indicators lend credence to this hypothesis. The Moving Average Convergence and Divergence (MACD) indicator has already experienced a bullish crossover, while the Relative Strength Index (RSI) retraced back to its midpoint, indicating a potential equilibrium in market sentiment. Furthermore, the trade volume indicator has exhibited a notable surge in histogram levels, corroborating the emerging market developments.
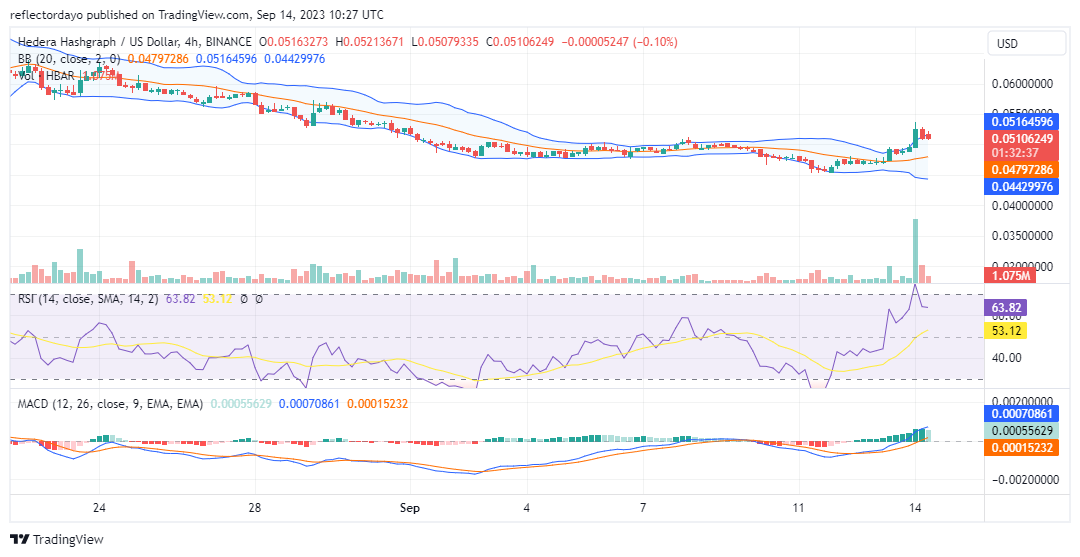
HBAR/USD 4-Hour Chart Outlook
While historical market performance might lead us to anticipate a natural price upturn, a closer examination of the 1-hour timeframe’s trade volume reveals a bit of discrepancy. Specifically, the considerable height of the volume histogram does not align with the strength exhibited by the bullish candlestick. This apparent discord suggests the presence of a divergence in market dynamics.
This discrepancy could be attributed to traders swiftly entering the market as it approached the historical price level, only to subsequently falter in their commitment to follow through with the trade. Such behavior often signifies a lack of sustained conviction in the market’s upward movement.
Consequently, it is conceivable that a consolidation trend may ensue in response to this recent development.