Immutable X (IMX/USD) Surges Above $1.60; Will It Sustain Above It?
Estimated Reading Time: 3 minutes
Don’t invest unless you’re prepared to lose all the money you invest. This is a high-risk investment and you are unlikely to be protected if something goes wrong. Take 2 minutes to learn more

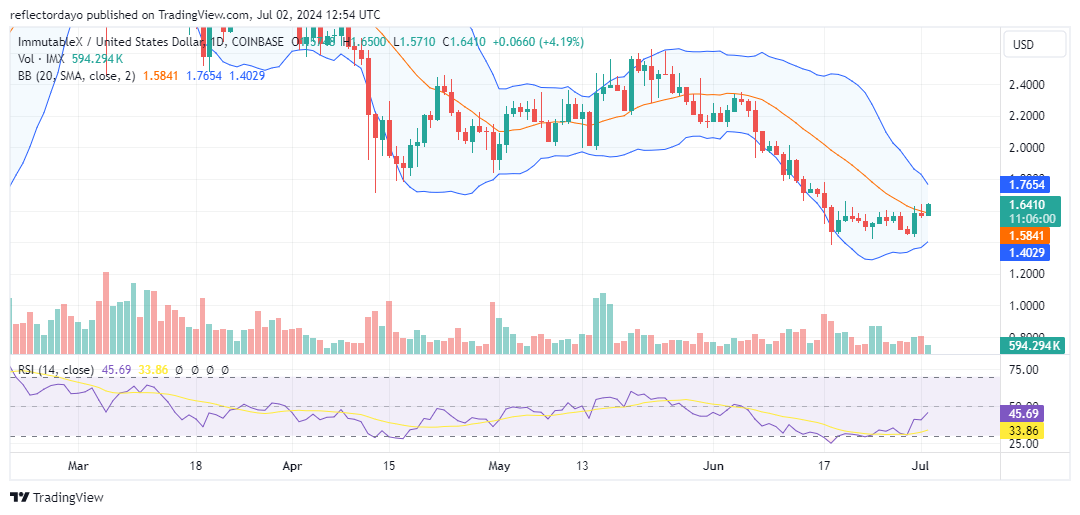
In the Immutable X market, the first half of June was bearish. However, by the second half of the month, $1.458 emerged as the support level, marking the point of bullish intervention. Despite this, the market still exhibited a strong bearish bias, with a resistance level emerging at $1.60. The establishment of this resistance level indicates that bearish forces remain prevalent. This resistance level persisted from June 19, resisting repeated bullish pressures, until today’s trading session, when the price broke out above this level.
Immutable X Market Data
- IMX/USD Price Now: $1.65
- IMX/USD Market Cap: $2.5 billion
- IMX/USD Circulating Supply: 1.5 billion
- IMX/USD Total Supply: 2 billion
- IMX/USD CoinMarketCap Ranking: #39
Key Levels
- Resistance: $1.70, $1.77, and $1.80
- Support: $1.45, $1.40, and $1.35.
Immutable X Market Through the Lens of Indicators
Since the emergence of the $1.60 resistance level, the price has consistently resisted repeated bullish advances. The bullish attempts were repeatedly rejected at this level until today, when the bulls finally succeeded in pushing the price above it, currently standing at $1.64. The candlestick representing this market activity is a marubozu candlestick. The appearance of this type of candlestick in today’s trading session is highly significant, indicating that the bulls were dominant and almost in control of the market for the day. Due to this, if a price action pullback occurs, the $1.60 price level could serve as a support level, encouraging the market to continue its upward trend.
Despite this bullish crypto signal from the price action, the Relative Strength Index (RSI) still measures in bearish territory, though the bearish momentum is rapidly decreasing, currently at a level of 45. Other factors to consider when anticipating a significant upsurge or bullish recovery include the fact that this development is occurring at the end of a bearish trend. Consequently, surges like this may continue to rise considerably higher. Additionally, breaking the $1.60 resistance level may encourage more traders to adopt a bullish sentiment and start buying.
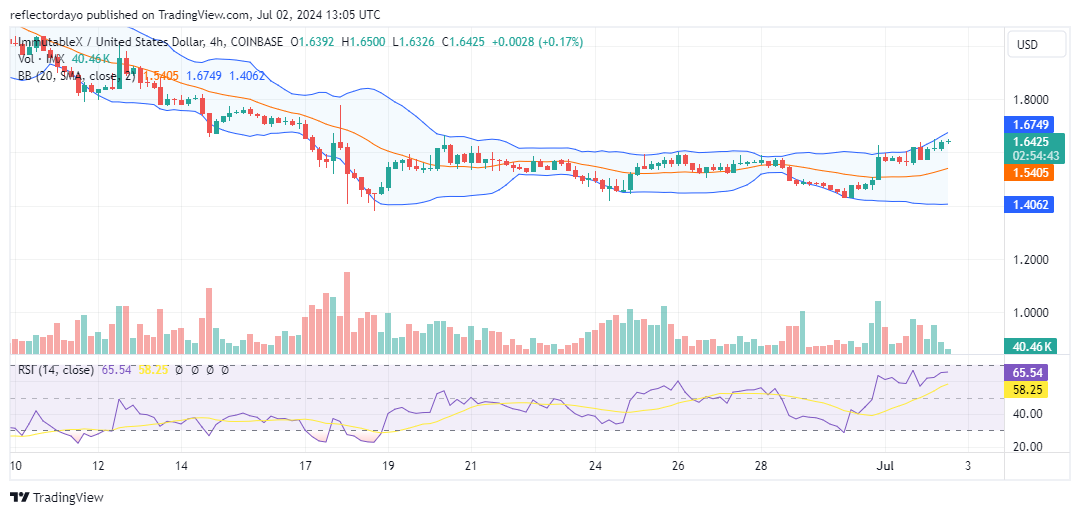
IMX/USD Price Prediction: 4-Hour Chart Analysis
However, considering the market from a smaller timeframe perspective, signs of bullish exhaustion have become apparent. Shortly after the market surged above the $1.60 price level, the candlestick patterns, particularly in the current 4-hour chart session, began to show smaller candlesticks. This observation is confirmed by a very small histogram in the recent trading session, indicating a reduction in investor interest. This suggests that traders may be cautious, possibly waiting to see if the $1.60 price level will establish itself as a new support level.