Kyber Network (KNC/USD) Witnesses an Influx of Traders Amidst Bullish Market Trends
Estimated Reading Time: 3 minutes
Don’t invest unless you’re prepared to lose all the money you invest. This is a high-risk investment and you are unlikely to be protected if something goes wrong. Take 2 minutes to learn more
The ongoing bull market on Kyber Network presents a notable one-sided trend, with the majority of traders adopting a bullish sentiment. This surge in bullish participation has contributed to the market’s struggle to establish a sustained higher support level since September 12, when the upward trajectory commenced.
Nevertheless, a select few traders have capitalized on the price surge to secure swift profits. However, their actions have not reversed the bullish momentum. On the contrary, the bullish price action has continued to ascend vigorously, even breaching the $0.700 price threshold.
Kyber Network Market Data
- KNC/USD Price Now: $0.69
- KNC/USD Market Cap: $120,588,651
- KNC/USD Circulating Supply: 170.69 Million KNC
- KNC/USD Total Supply: 252,301,550 KNC Coins
- KNC/USD CoinMarketCap Ranking: #203
Key Levels
- Resistance: $0.800, $0.850, and $0.900.
- Support: $0.550, $0.500, and $0.450.
Price Prediction for Kyber Network: The Indicators’ Point of View
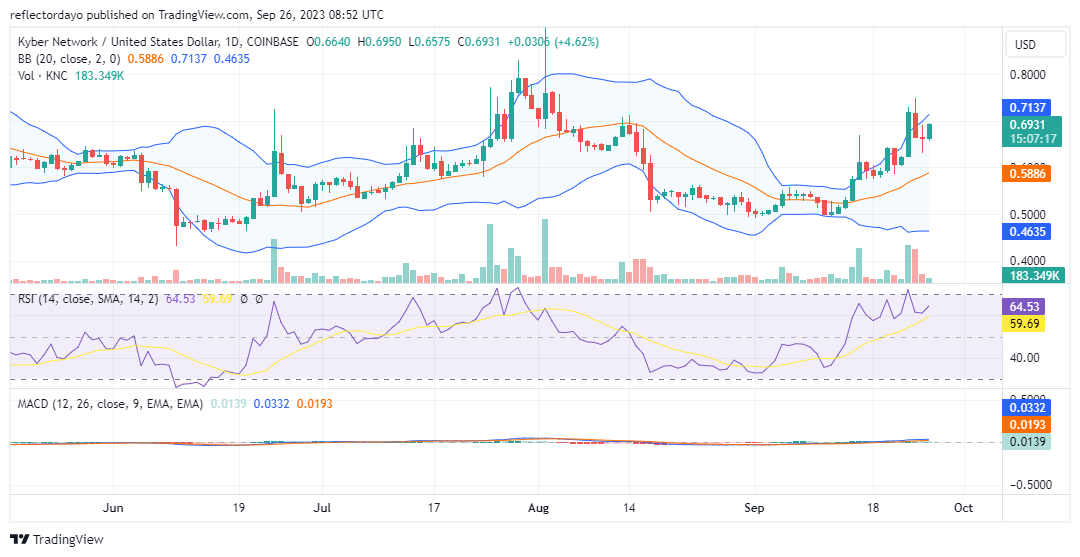
When assessing the Kyber Network market through the lens of technical indicators, a notable concern arises regarding the sustainability of the current bullish trend. The prevailing scenario hints at the possibility of an overheated market where demand appears to substantially outpace supply. In such a context, there is a potential for a market correction to bring prices in line with their intrinsic value.
Examining the Bollinger Bands indicator reveals several insights. Firstly, the upper standard deviation is indicative of the market’s robust bullish performance, which is reinforced by the behavior of the simple moving average. Both of these curves exhibit an upward trajectory. However, the lower standard deviation remains relatively flat, suggesting that downside volatility and support levels have not experienced substantial alterations. This could imply that the recent price surge might be perceived by the market as an anomaly rather than a sustainable trend.
Conversely, the volume of trade indicator appears to align with the bullish trend, as evident in the significant histograms. This suggests that market participants are actively engaging in buying activities, further corroborating the current bullish sentiment.
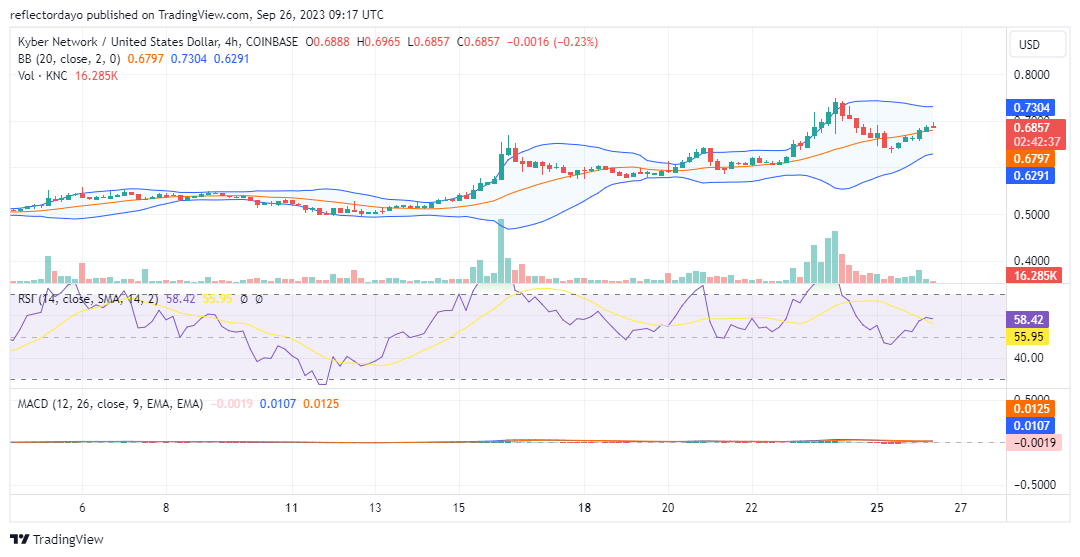
KNC/USD 4-Hour Chart Outlook
Upon closer examination of the shorter-term market outlook, a notable development has emerged: the gradual establishment of a sustainable support level. This support level holds significant potential as a pivot point for the continuation of the prevailing bullish trend. An analysis of the market’s components within the framework of Bollinger Bands reinforces bullish sentiment.
However, as the market approaches the $0.700 price threshold, there is evidence of diminishing trading volume and a narrowing of the Bollinger Bands. These observations indicate a potential equilibrium between supply and demand at this specific price level.