LayerZero (ZRO/USD) Rebounds to $2.50 Before Facing Bullish Resistance
Estimated Reading Time: 3 minutes
Don’t invest unless you’re prepared to lose all the money you invest. This is a high-risk investment and you are unlikely to be protected if something goes wrong. Take 2 minutes to learn more

On June 21, the bearish trend in the LayerZero market bottomed out at the $1.50 level, marking a pivotal turning point as the price shifted upward. Bullish momentum persisted despite encountering resistance along the way, eventually driving the market to a significant hurdle at $2.50.
At that point, market volatility surged, intensifying the resistance and triggering a sharp pullback. The decline ultimately found support at the $1.64 level—a higher low that could serve as a key reference point for traders assessing the next bullish attempt.
LayerZero (ZRO/USD) Market Data
- ZRO/USD Price Now: $2.35
- ZRO/USD Market Cap: $411.9 million
- ZRO/USD Circulating Supply: 174.18 million ZRO
- ZRO/USD Total Supply: 1 billion
- ZRO/USD CoinMarketCap Ranking: #143
Key Levels
- Resistance: $2.50, $3.00, and $3.50
- Support: $1.90, $1.80, and $1.70
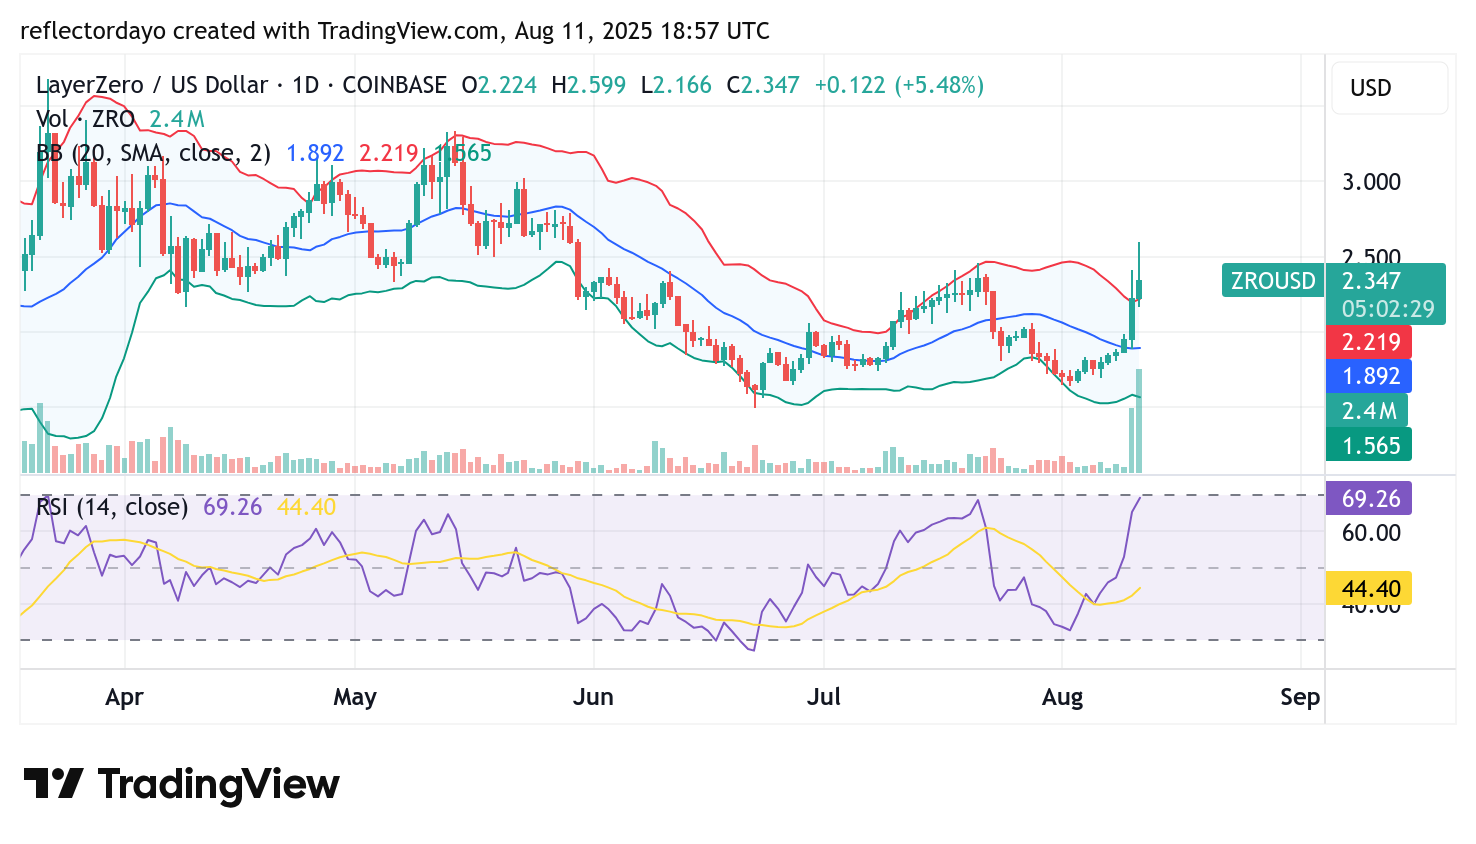
LayerZero (ZRO/USD) Technical Outlook (Daily Chart)
Indicators reveal a significant level of volatility in the LayerZero market, as clearly illustrated by the wide bandwidth of the Bollinger Bands. This heightened volatility explains the sharp swings in price action between lower and upper price zones.
After finding support at the $1.65 level, the crypto signal shifted upward and quickly advanced toward the key $2.50 resistance. The bulls managed to test this level, but a failure to sustain above it prompted profit-taking, pulling the price back to around $2.35.
Trading volume reflects a generally positive sentiment among participants, suggesting that buyers remain inclined to push the market higher. However, both the elevated volatility and the strong resistance at $2.50 will be critical factors in determining whether the bullish momentum can be maintained.
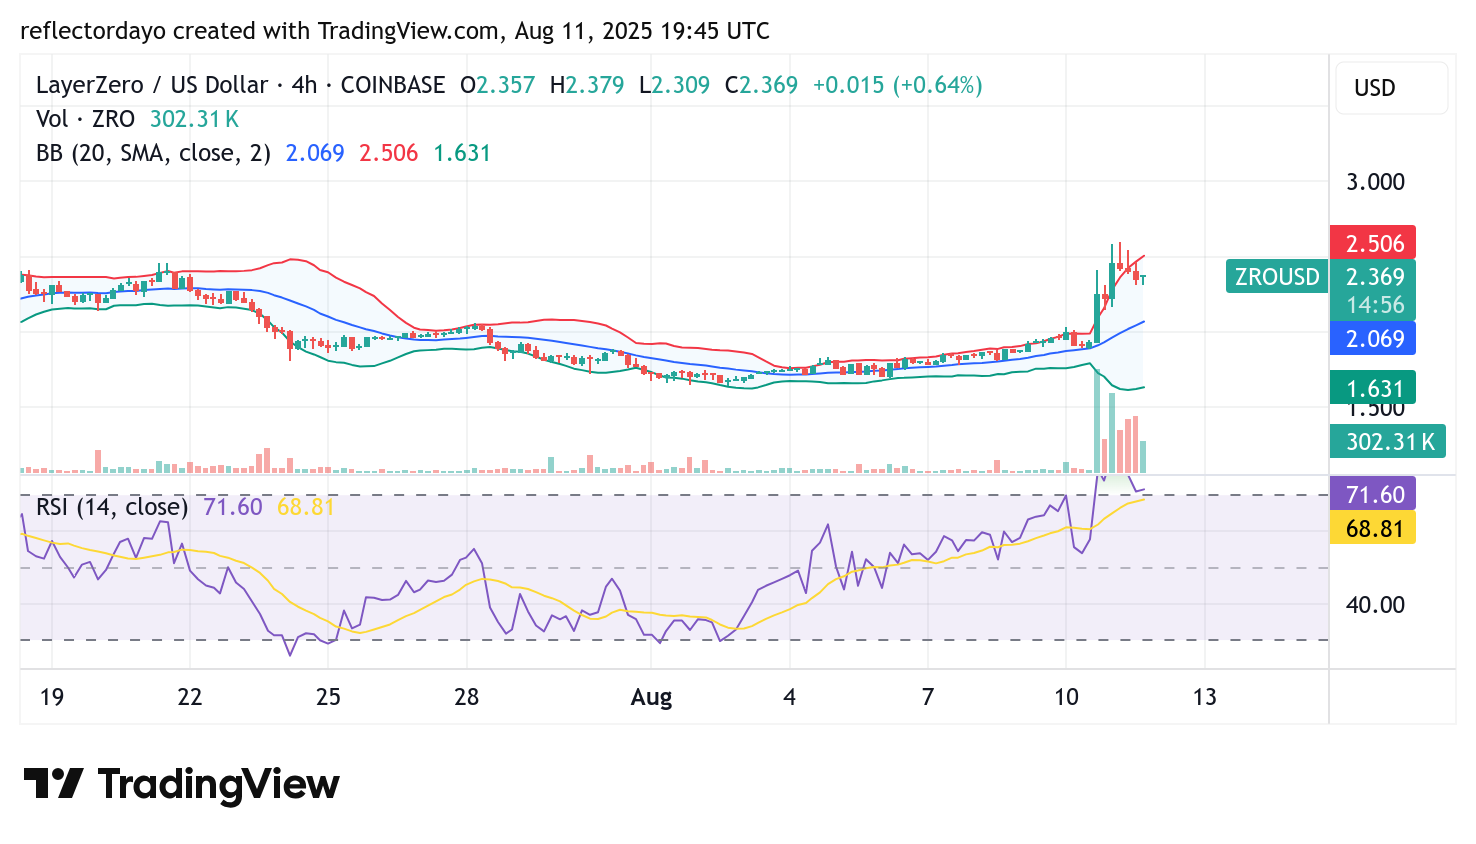
ZRO/USD 4-Hour Chart
Indicators suggest that the current pullback is a warranted correction, with the market still retaining the potential to resume its upward trend once this pause concludes. The Relative Strength Index (RSI) shows that in recent sessions, the market entered the overbought territory, making the present decline a likely technical correction.
Notably, price action around the $2.348 level reflects underlying bullish sentiment. If volatility eases, this area could serve as a launch point for another upward move.