Lido DAO (LDO/USD) Makes a Notable Recovery from $1.5
Estimated Reading Time: 3 minutes
Don’t invest unless you’re prepared to lose all the money you invest. This is a high-risk investment and you are unlikely to be protected if something goes wrong. Take 2 minutes to learn more

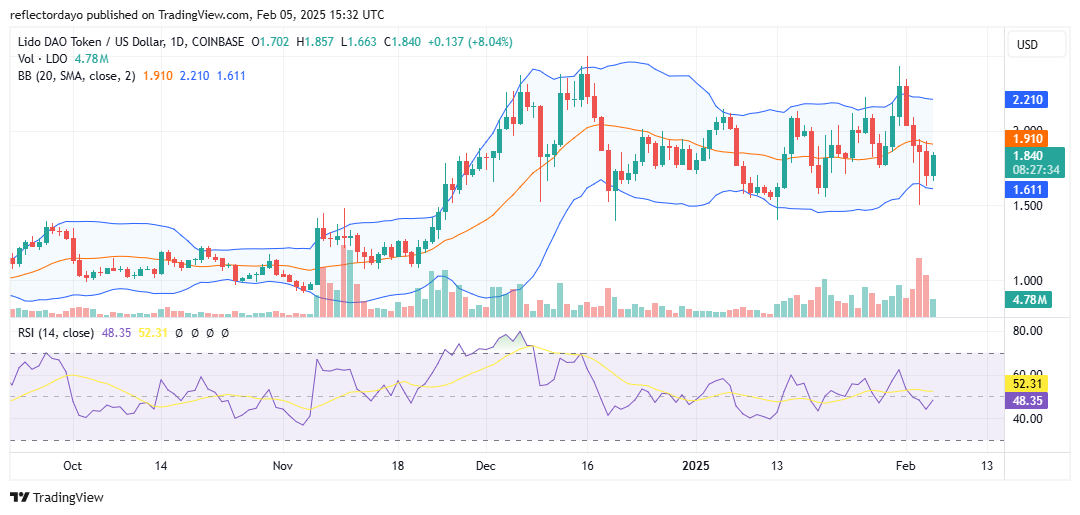
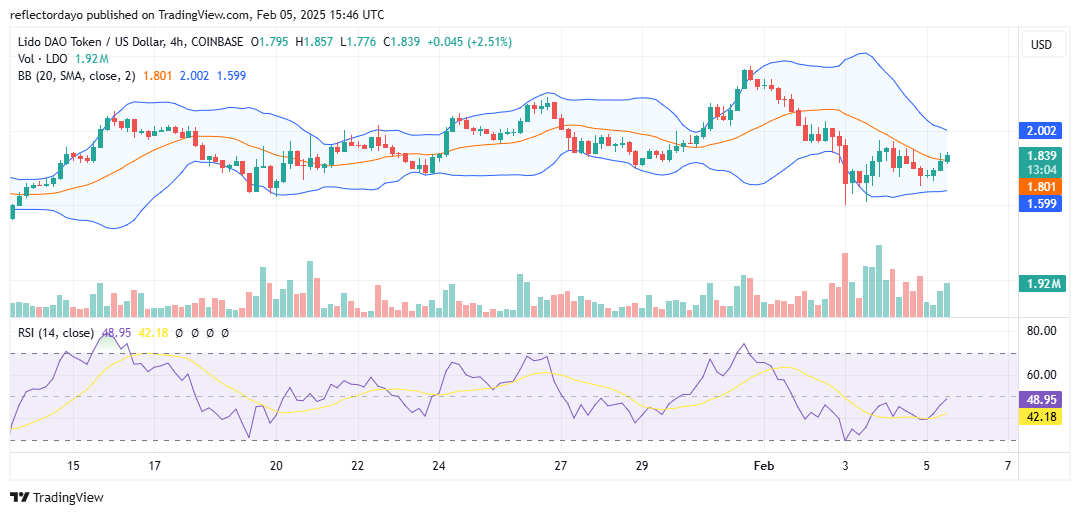
The Lido DAO market has made a significant rebound after touching the $1.50 price level. However, the overall market remains in a consolidation phase, trading within a ranging price channel. Notably, the price is still positioned below the 20-day moving average, indicating that bearish pressure remains dominant.
Despite this bearish advantage, the repeated rejection of the $1.50 level since February 3 suggests strong buying interest from the bulls. This level appears to be a key demand zone, which could facilitate a more sustained bullish recovery if buyers maintain control.
The Lido DAO Market Data
- LDO/USD Price Now: $1.84
- LDO/USD Market Cap: $1.6 billion
- LDO/USD Circulating Supply: 895.9 million LDO
- LDO/USD Total Supply: 1 billion LDO
- LDO/USD CoinMarketCap Ranking: #57
Key Levels
- Resistance: $2.00, $3.00, and $3.50
- Support: $1.50, $1.00, and $0.50.
The Lido DAO Market Through the Lens of Indicators
Recently, the Lido DAO market has shown a noticeable increase in trading volume, as reflected by the rising histogram heights. This indicates a surge in market activity. However, despite this uptick, the market remains in a consolidation phase, trading within the $1.50 to $2.50 price range. The Bollinger Bands also highlight substantial bandwidth, signaling increased volatility, which suggests that the price may swing rapidly within this horizontally moving price channel.
In such a market environment, it would be ideal for traders to buy near the $1.50 support level, positioning themselves to capitalize on potential upward swings and quickly capture profits at key resistance levels.
LDO/USD Price Prediction: 1-Hour Chart Analysis
Zooming into the shorter timeframe, it appears that bearish pressure has settled around the $1.88 price level. Considering this development from the 4-hour chart, there is a possibility that volatility is decreasing, which is commonly referred to as a “volatility squeeze.” This emerging trend may signal that the crypto market is preparing to break out in a clear direction. Traders should closely monitor the situation for any signs that indicate the next potential market move and determine the direction the market will take.