Litecoin (LTCUSD) Is Set to Re-attempt the $114 Resistance Level
Estimated Reading Time: 2 minutes
Don’t invest unless you’re prepared to lose all the money you invest. This is a high-risk investment and you are unlikely to be protected if something goes wrong. Take 2 minutes to learn more
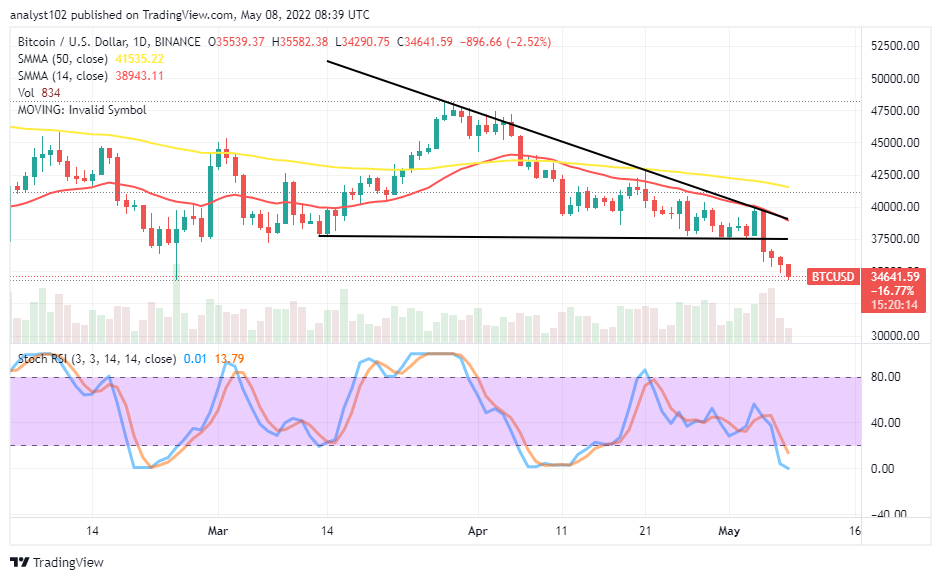
Towards the end of June, the Litecoin bull market experienced a surge in liquidity. The substantial buying pressure propelled the price very close to the $114 price level. Before the trading session concluded on June 30, some traders had started to take their profits. However, the bullish sentiment remained strong, which helped maintain the price at a high level. A support level was established at $106 to sustain the market’s bullish trajectory.
Despite the price pullback, the market largely remains on a bullish course, although some traders are taking their profits.
Litecoin Market Data
- LTC/USD Price Now: $100.71
- LTC/USD Market Cap: $7,427,746,103
- LTC/USD Circulating Supply: 73,350,464 LTC
- LTC/USD Total Supply: $84,000,000
- LTC/USD CoinMarketCap Ranking: #10
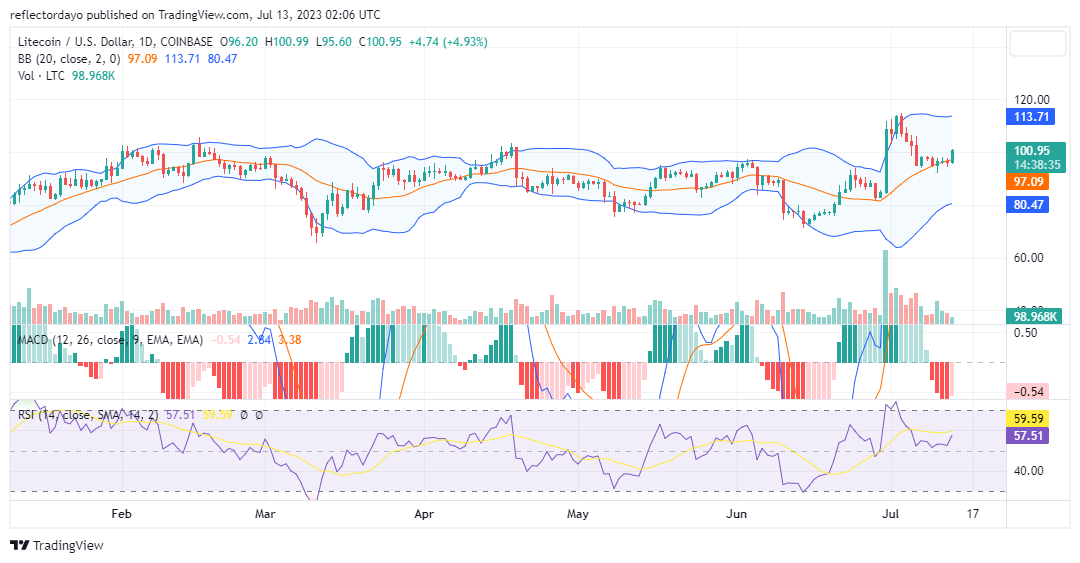
Key Levels
- Resistance: $114.00, $120.00, and $128.00.
- Support: $90.00, $80.00, and $75.00.
Price Prediction for Litecoin: The Indicators’ Point of View
The $114 price level became a major psychological threshold, leading to continued profit-taking. A significant bear market began on July 3, originating at a crucial resistance level. The bear market gained momentum until Litecoin buyers found solid support at the $94.72 price level.
Analyzing the market through the lens of the Bollinger Bands indicator, we observe that the new support level is positioned above the 20-day moving average. This indicates that buyers intervened just in time to prevent the market from dropping below the moving average and entering the sell zone. This explains the strong bullish price movement witnessed in today’s trading session. Following a period of consolidation, the market eventually rallied toward the key resistance level.
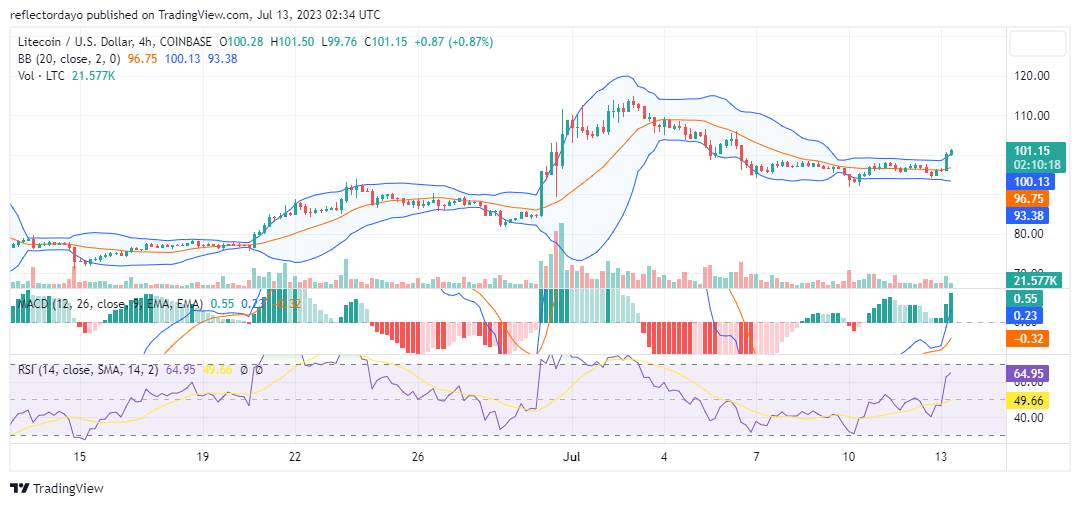
LTC/USD 4-Hour Chart Outlook
From a 4-hour perspective of the market, we can observe a breakout from a horizontally moving price channel. The Bollinger Bands indicator reveals the divergence of the two standard deviation curves as the price breaks out to the upside. This indicates an escalation in volatility levels, which is expected when the price experiences a significant upward breakout.