Litecoin (LTCUSD) Might Be on the Verge of Exploding to the Upside
Estimated Reading Time: 2 minutes
Don’t invest unless you’re prepared to lose all the money you invest. This is a high-risk investment and you are unlikely to be protected if something goes wrong. Take 2 minutes to learn more
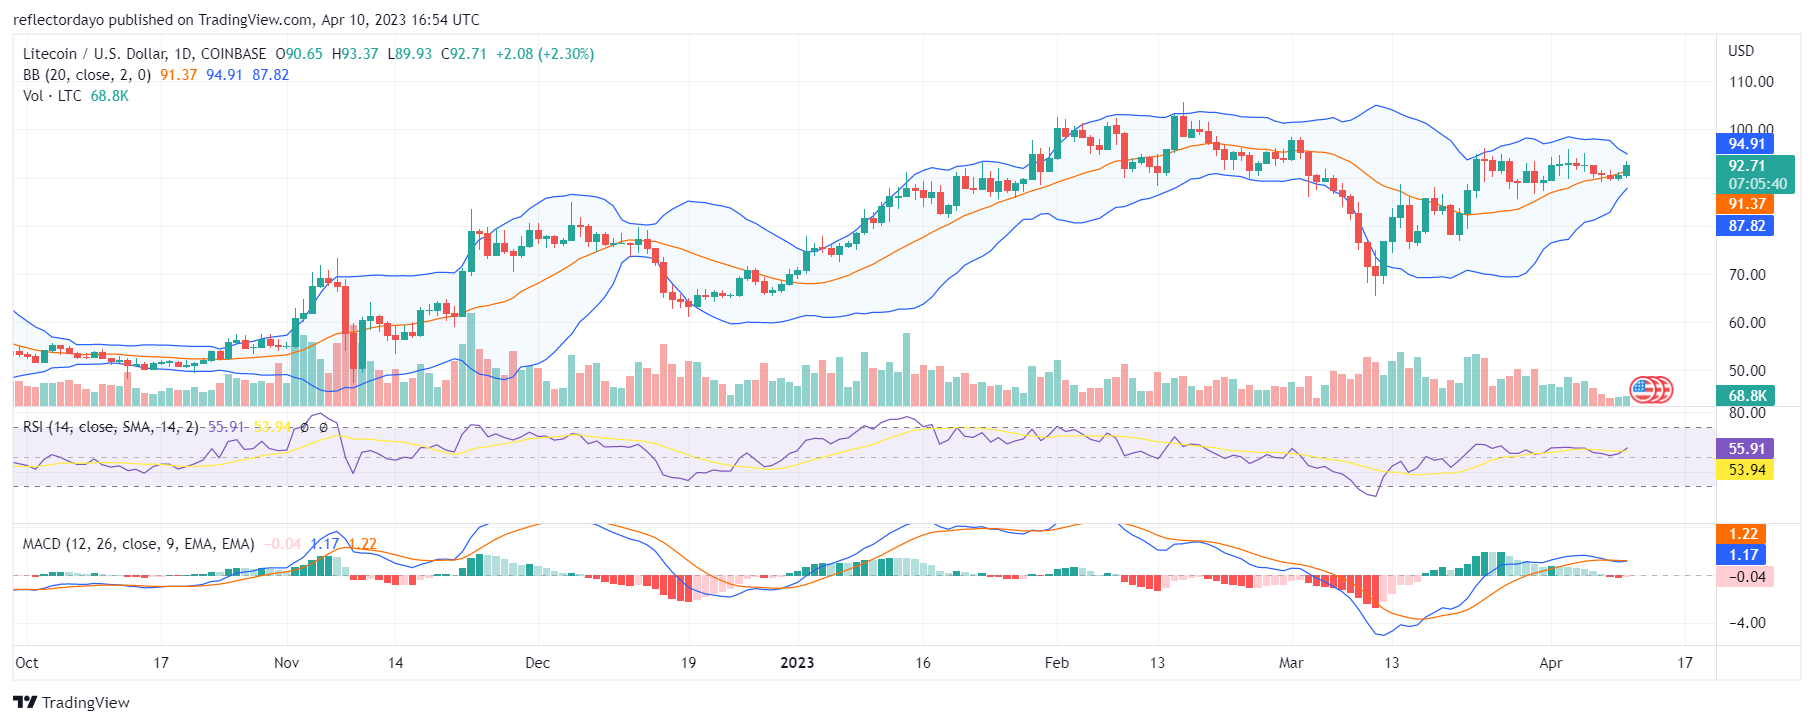
Since the beginning of April, the Litecoin market has seen strong pulls and pushes from both the demand side and the supply side without any significant change in the position of the price. The market has maintained a sideways movement within the $89.49 and 93.10 price channels. Both the support level and the resistance level have continued to be insurmountable. But for today’s market, like the first day of April, we are seeing strong bullish sentiment, and the deadlock might be broken soon.
LTC/USD Price Statistics
- LTC/USD Price Now: $92.26
- LTC/USD Market Cap: $6,706,309,839
- LTC/USD Circulating Supply: 72,676,152 LTC
- LTC/USD Total Supply: 84,000,000
- LTC/USD CoinMarketCap Ranking: #14
Key Levels
- Resistance: $95.00, $100.00, and $105.00
- Support: $90.00, $85.00, and $80.00
Price Prediction for Litecoin: The Indicators’ Point of View
In response to today’s bullish run, the Bollinger Bands indicator converges sharply, and that could mean that the market is gaining traction from the bullish zone. The resistance level is now under pressure, and it might break soon. However, from the standpoint of the Relative Strength Index (RSI), the momentum is not too strong since the RSI line measures 55.9. The measurement is not far from the midpoint of the indicator. However, Litecoin is set in a bullish direction; it just needs an increase in the volume of trade to propel it further.
LTC/USD 4-Hour Chart Outlook:
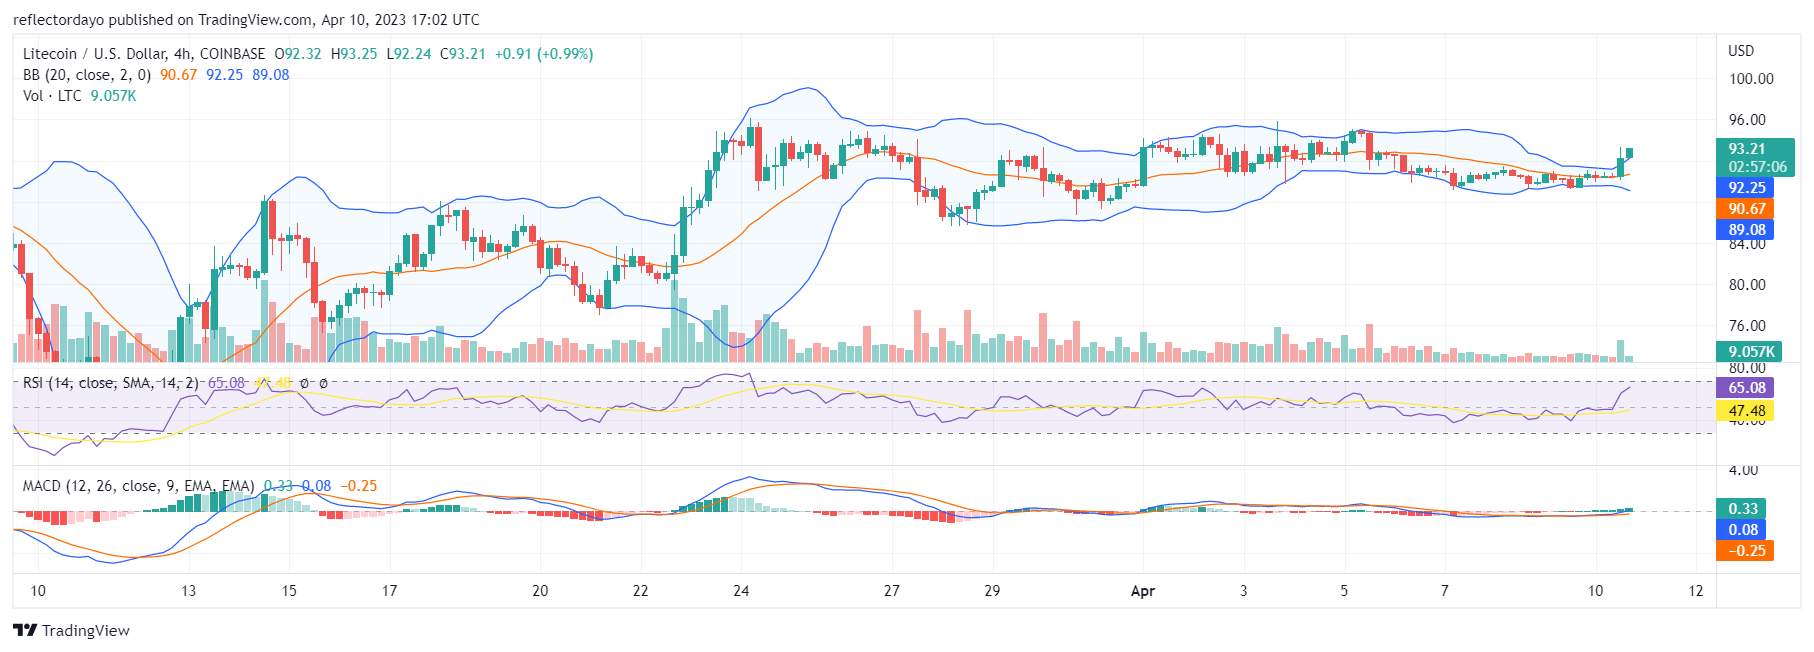
From the perspective of the 4-hour chart, the market is already seeing the beginning of the expected bullish price breakout. However, the volume of trade also seems to be on the low side, and that may be the reason why the upper band of the Bollinger Bands is a bit behind the price action. According to the Bollinger Bands indicator, the market is in the overbought region, which means it might draw back a bit, correcting itself into the bands. But the Relative Strength Index has a different opinion, and there is still room for more bullish action.