Livepeer (LPTUSD) Bulls Intensify Push Towards $7.85 as They Navigate Recent Breakout
Estimated Reading Time: 2 minutes
Don’t invest unless you’re prepared to lose all the money you invest. This is a high-risk investment and you are unlikely to be protected if something goes wrong. Take 2 minutes to learn more
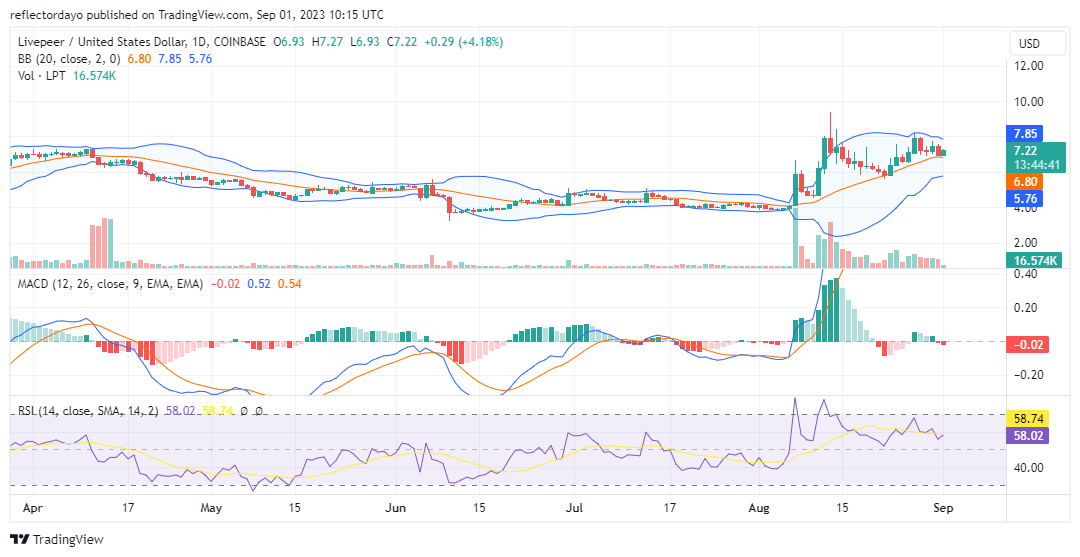
Livepeer has been entrenched in a sideways ranging market since June 11, with the bulls finally breaking free from the deadlock at the $4.10 price level in early August, specifically on August 7. This breakout led to a peak of $9.39 on August 13. Although a significant bearish phase followed, buyers managed to defend substantial bullish territory, establishing a resilient support level at $6.00.
Livepeer Market Data
- LPT/USD Price Now: $7.22
- LPT/USD Market Cap: $208,723,040
- LPT/USD Circulating Supply: 28,877,828 LPT
- LPT/USD Total Supply: 28,877,828 LPT
- LPT/USD CoinMarketCap Ranking: #125
Key Levels
- Resistance: $8.00, $8.50, and $9.00.
- Support: $6.00, $5.50, and $5.00.
Price Prediction for Livepeer: The Indicators’ Point of View
Recent developments indicate a positive shift in Livepeer market dynamics. Over the past two days, a higher support level has emerged, positioned comfortably above the 20-day moving average. Notably, the Bollinger Bands initially diverged due to the explosive volatility witnessed in early August. However, as the market recommences its ascent towards the critical resistance level of $8.00, there is a noticeable convergence occurring within the Bollinger Bands.
These developments suggest that Livepeer is poised for a potential breakthrough at the $8.00 resistance level. Traders should closely monitor this crucial level, as it could act as a significant inflection point for the asset’s price trajectory in the near term. Additionally, the establishment of a higher support level signifies growing investor confidence, potentially fueling further upward momentum.
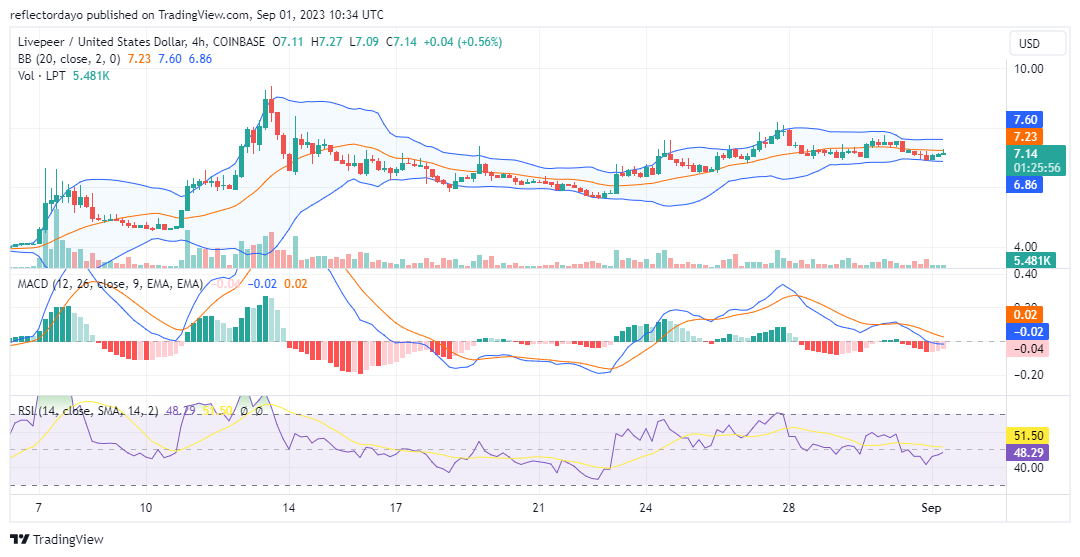
LPT/USD 4-Hour Chart Outlook
On the 4-hour chart, the market’s higher lows are clearly pronounced. This could contribute to bullish sentiment among traders. Traders and investors may interpret this as a signal to maintain long positions in the market or even consider adding to them, with expectations of higher prices in the future. Now, traders should monitor the potential breakout above the current 20-day moving average and the $8.00 level, which could serve as a key point of interest for bearish activity.