Lucky Block (LBLOCK/USD) Market Declines Alongside the Diagonal Resistance
Estimated Reading Time: 2 minutes
Don’t invest unless you’re prepared to lose all the money you invest. This is a high-risk investment and you are unlikely to be protected if something goes wrong. Take 2 minutes to learn more

Lucky Block Price Forecast – June 24
The LBLOCK/USD market declines alongside the diagonal resistance. The diagonal resistance has proven difficult to breach as the bulls keep failing to cause a successful breakout to the upside.
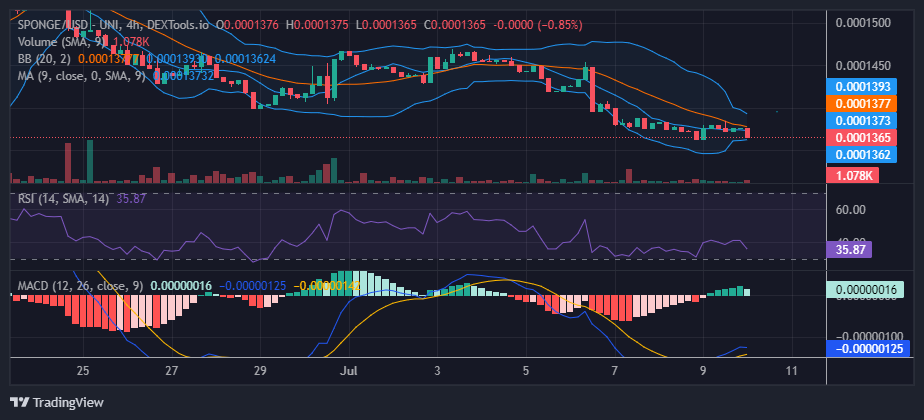
The Simple Moving Average (SMA) with 9 days is positioned above the current price level, which typically signals ongoing downward momentum. Furthermore, the Moving Average Convergence Divergence (MACD) histogram is in the negative territory with its signal line and MACD line diverging, indicating sustained selling pressure. The MACD’s negative bars are growing, reinforcing the bearish sentiment.
LBLOCK/USD Market Key Levels:
Resistance levels: $0.00002280, $0.00004500, $0.00007500
Support levels: $0.00001860, $0.00000930, $0.00000120
LBLOCK/USD – Daily Chart
The daily chart for LBLOCK/USD shows that the market keeps declining alongside the diagonal resistance.
The price has been declining steadily since mid-May. Analyzing the price action on the chart, there is a clear downtrend marked by lower highs and lower lows.
The recent Break of Structure (BOS) indicates that attempts to rally have failed. The price continues to follow the descending trendline, approaching the next major support at $0.00000930.

What are the critical points to watch out for for a potential reversal for LBLOCK/USD?
The projection for LBLOCK/USD remains bearish, with the price expected to continue its downward trajectory. The next significant support level lies around $0.00000930, which, if broken, could open the path to the subsequent support at $0.00000120.

LBLOCK/USD – Four-Hour Chart
The LBLOCK/USD pair on the four-hour chart is exhibiting a bearish trend, evidenced by its consistent lower highs and lower lows. The price is trading below the 9-period SMA at 1710, reinforcing the downward pressure. The projected path suggests a minor retracement towards 0.00001950, probably forming a double top before continuing the overall bearish trend.
Lucky Block (LBLOCK) Current Statistics
The current price: $0.00001690
Market Capitalization: $1,200,000
Trading Volume:$1,980
Do you need a coin that will 100X soon? Get LBLOCK here