Maker (MKR/USD): Bulls Set New Targets
Estimated Reading Time: 2 minutes
Don’t invest unless you’re prepared to lose all the money you invest. This is a high-risk investment and you are unlikely to be protected if something goes wrong. Take 2 minutes to learn more
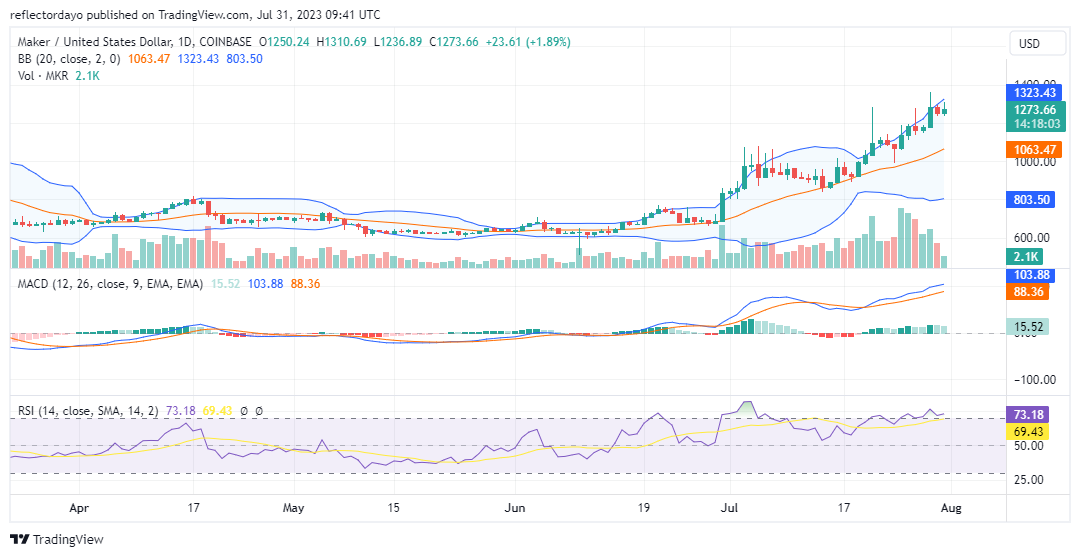
On July 21, the Maker market encountered significant resistance at $1200. However, the resistance was successfully breached on July 29, following the establishment of robust support at $1157. This support played a crucial role in enabling the market to break past the $1200 price level on July 29. The bullish momentum on that day was substantial, prompting a bearish response when prices reached a high of $1360. Nevertheless, due to the prevailing bullish sentiment, the market was able to recover and stabilize at the $1245 price level.
Maker Market Data
- MKR/USD Price Now: $1273
- MKR/USD Market Cap: $1,240,822,156
- MKR/USD Circulating Supply: 977,631 MKR
- MKR/USD Total Supply: 977,631 MKR
- MKR/USD CoinMarketCap Ranking: #41
Key Levels
- Resistance: $1300, $1350, and $1400.
- Support: $1050, $1000, and $950.
Price Prediction for Maker: The Indicators’ Point of View
After successfully breaking the resistance at $1200, the Maker bulls embarked on a journey toward the $1400 price level. Currently, the market faces some resistance around $1300, but the presence of a nearby support level at $1246 enhances the possibility of the bullish trend continuing.
However, increasing market volatility is a growing concern, as indicated by the Bollinger Bands. This development may signal that the bears are also gaining strength as the market strives for new heights. Similarly, the Relative Strength Index (RSI) might contribute to a growing bearish sentiment given that the market is hovering in overbought territory.
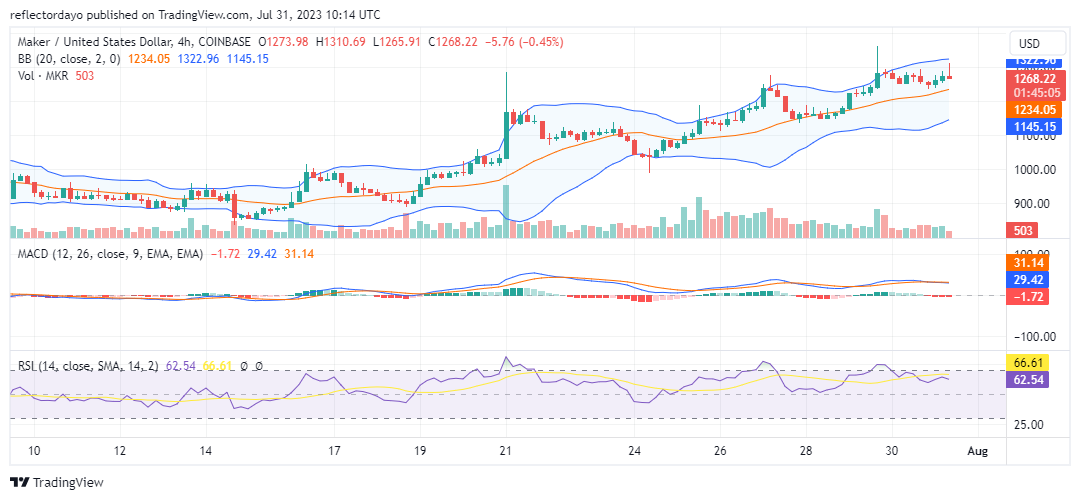
MKR/USD 4-Hour Chart Outlook
From this standpoint, we can observe the ongoing struggle between demand and supply near the key resistance level of $1300. Traders should be attentive to the emergence of an inverted hammer in the third 4-hour session, as it could indicate that bears are gaining strength around this newly established supply level. Such a pattern might potentially signal a trend reversal taking place at this point.