Maker (MKR/USD) Market Outlook: Bulls Challenge Key Resistance at $1,600 to Reverse Downtrend
Estimated Reading Time: 4 minutes
Don’t invest unless you’re prepared to lose all the money you invest. This is a high-risk investment and you are unlikely to be protected if something goes wrong. Take 2 minutes to learn more
Maker (MKR/USD) has been in a persistent downtrend following its previous bullish rally, which peaked at $1,967—just shy of the psychological $2,000 level. The decline was largely triggered by profit-taking activities, pushing the market into a corrective phase.
During the prior rally, the $1,600 price level served as a notable resistance point. As the bearish pressure intensified, that level was once again tested—this time from above—eventually breaking to the downside. Despite brief support attempts around $1,600, sellers maintained control, dragging the price further down until a temporary bottom formed near the $1,500 zone.
It was at this $1,500 support that bullish interest re-emerged. Buyers stepped in and initiated a recovery, pushing the price back toward the $1,600 resistance level. A breakout above this key threshold has now attracted increased bullish momentum, raising the possibility of a trend reversal.
The key question now is whether this recovery rally has enough strength to decisively end the broader bearish trend and re-establish upward momentum in the MKR/USD market.
Maker Market Data
- MKR/USD Price Now: $1,673
- MKR/USD Market Cap: $1.4 billion
- MKR/USD Circulating Supply: 870.8K MKR
- MKR/USD Total Supply: 1 million
- MKR/USD CoinMarketCap Ranking: #3201
Key Levels
- Resistance: $2,000, $2,100, and $2,200
- Support: $1,600, $1,500 and $1,400
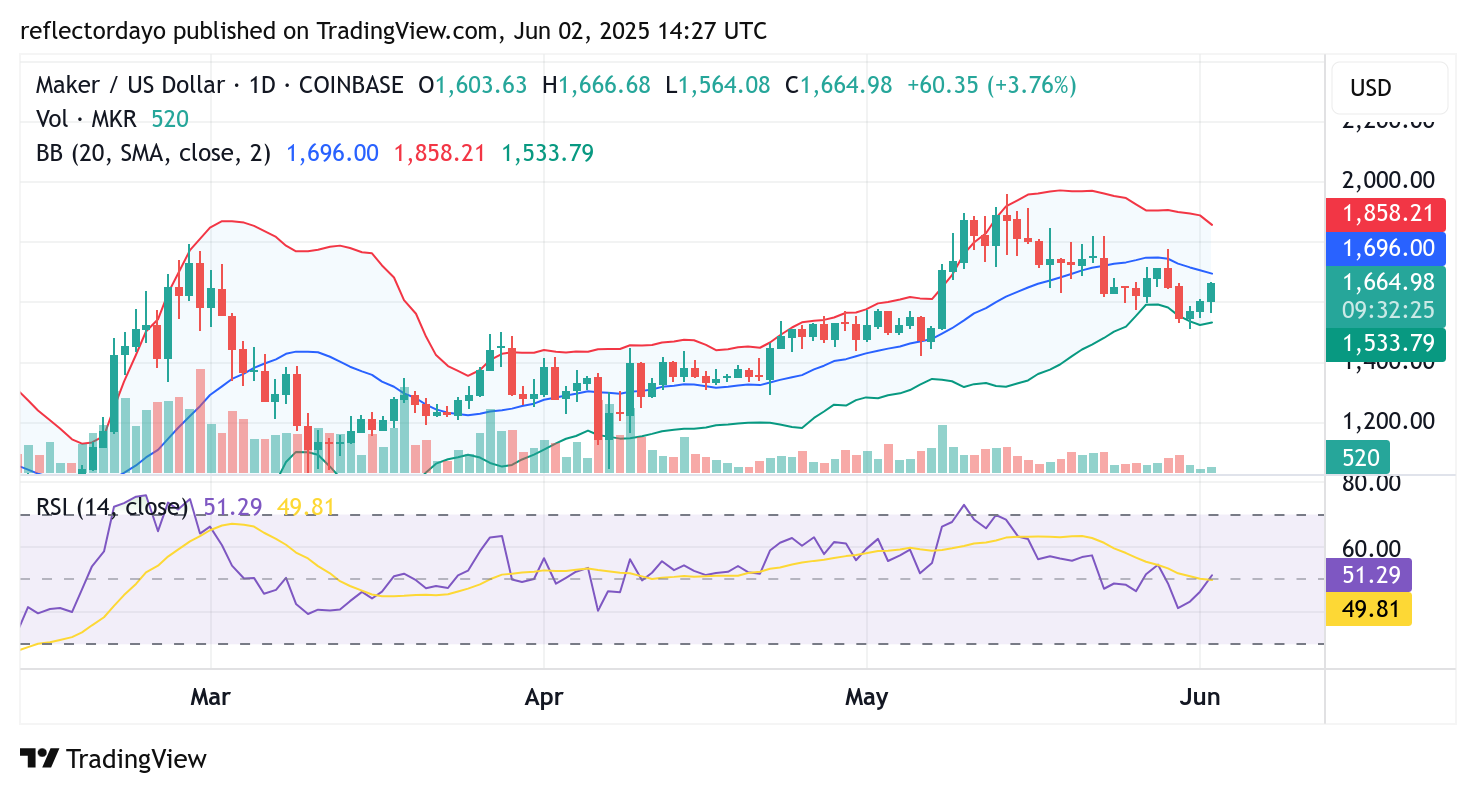
Maker (MKR/USD) Technical Outlook: Bulls Regain Momentum, But $1,700 Remains the Key Test
On the daily chart, Maker (MKR/USD) continues to exhibit a series of descending peaks—an indication of sustained bearish momentum. After reaching a high near the $2,000 level in mid-May, the market experienced a sharp increase in volatility. Although interest in the asset surged during that period, conflicting sentiments led to indecision, which ultimately gave way to a broader downward movement.
As the price approached the $1,600 level, bearish momentum began to slow. However, this key support failed to hold, and the market dipped further to find a critical bounce zone around $1,500. From that point, bulls stepped back in, initiating a rebound.
In today’s trading, it is notable that the price has finally broken above the $1,600 resistance level—an encouraging sign for buyers. Nevertheless, despite the strength of the ongoing recovery, the market remains technically in bearish territory, as price action is still positioned below the 20-day moving average.
For a confirmed trend reversal, bulls will need to push beyond the $1,700 mark, where the 20-day moving average currently resides. Until then, the focus remains on whether this key resistance will be breached to validate a shift in momentum.
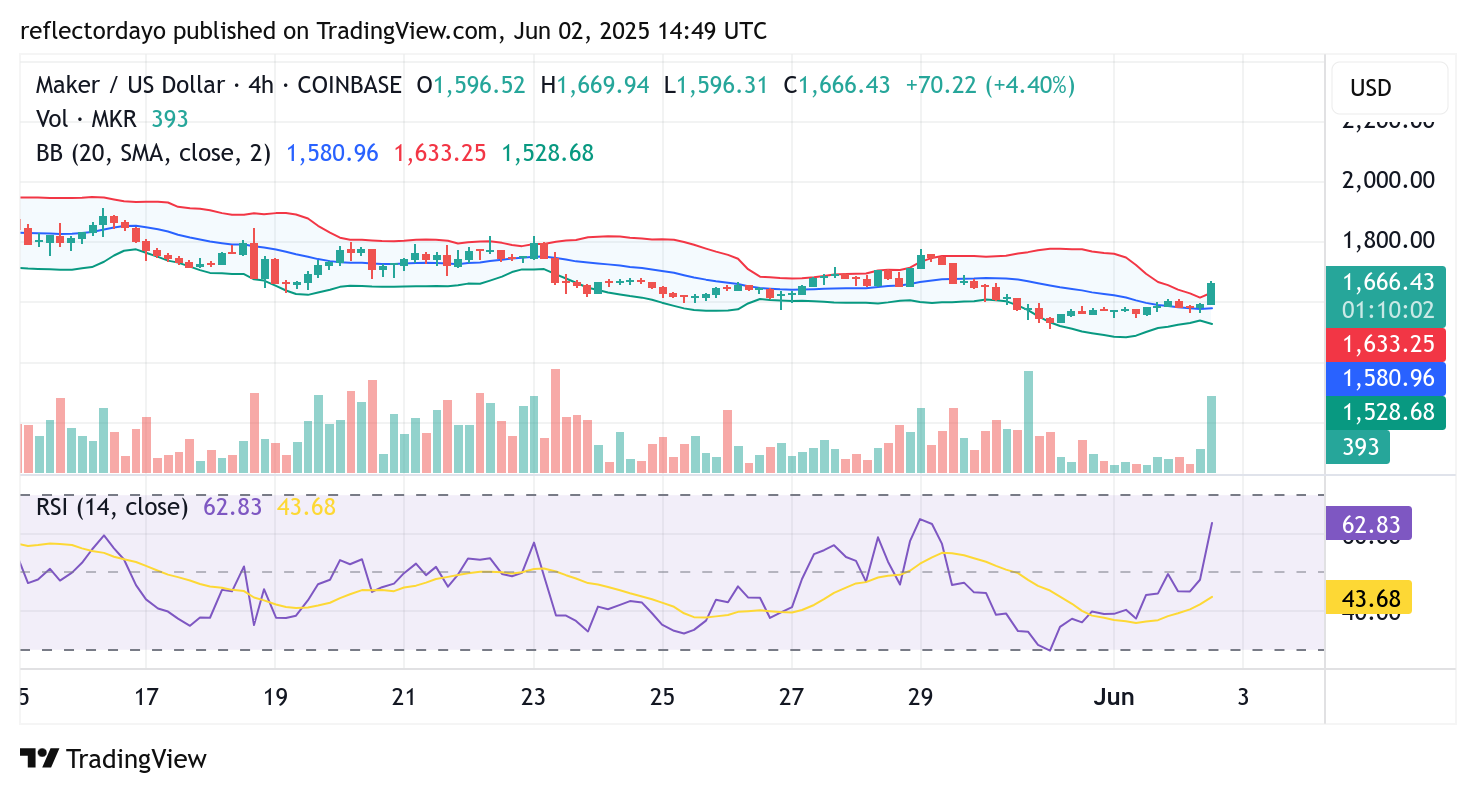
MKR/USD 4-Hour Chart Analysis: Bullish Activity Accelerates, But Signs of Caution Emerge
Analyzing the market from the 4-hour chart perspective, a notable increase in bullish activity is evident. This is clearly reflected in the sizeable histogram bars of the volume indicator during the current trading session, which signal heightened participation and buying interest.
However, despite the surge in trading volume and the strong reading from the Relative Strength Index (RSI), the corresponding candlestick lacks the strength one might expect. This divergence suggests that momentum could be weakening or that traders are exercising caution as the price approaches the critical $1,700 resistance level.
The current setup implies a potential for either short-term exhaustion or a pause in the rally, as market participants assess the next move at this key technical threshold.