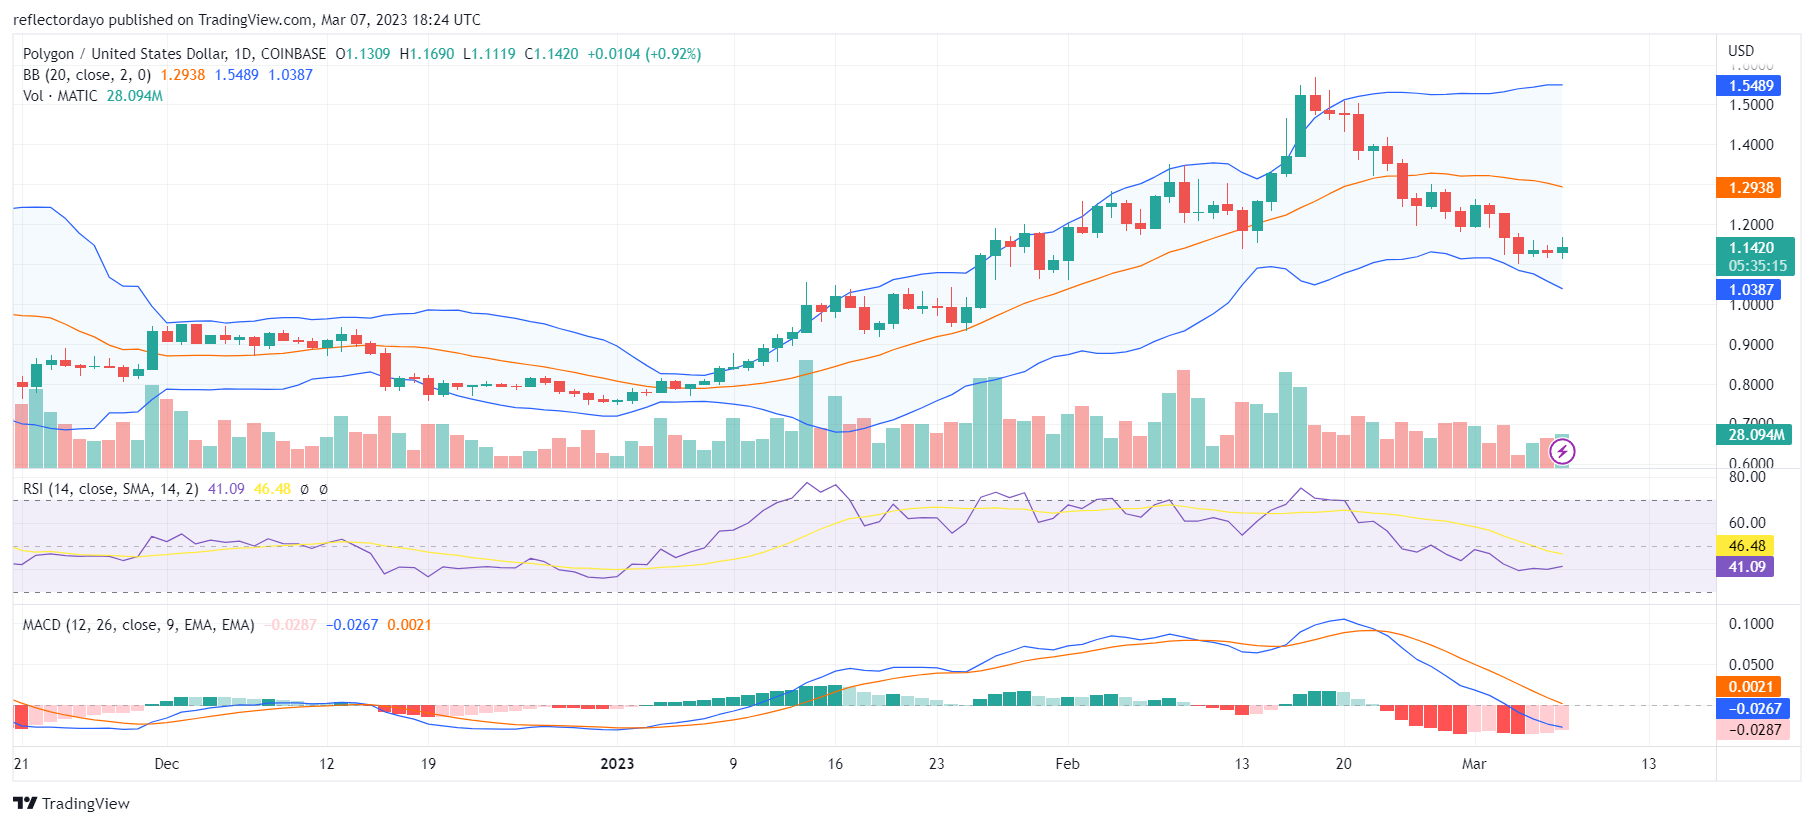
Polygon (MATICUSD) Price Finds Refuge at the $1.129 price Level
Estimated Reading Time: 2 minutes
Don’t invest unless you’re prepared to lose all the money you invest. This is a high-risk investment and you are unlikely to be protected if something goes wrong. Take 2 minutes to learn more
The Polygon bear market that was triggered at the $1.53 resistance level on February 18 appears to be coming to an end at the $1.129 support level. For the previous daily session, the appearance of Doji candlestick patterns was a pointer that the bearish trend is weakening as it approaches the key support level. The bullish trend may be resuming at this level because, in the middle of February, the bulls launched the market above the $1.5 price level in just four days. Signs of a trend reversal or bearish divergence were already showing on the third day of the trend after which, we see the bears taking the market.
MATIC/USD Price Statistic
- MATIC/USD price now: $1.14
- MATIC/USD market cap: $9,962,490,458
- MATIC/USD circulating supply:$9,962,490,458
- MATIC/USD total supply: 10,000,000,000
- MATIC /USD coin market cap rank: #8
Key Levels
- Resistance: $1.20, $1.30, $1.40
- Support: $1.00, $0.90, $0.80
Price Prediction Polygon: the Indicators’ Point of View
On February 14, when the bulls became so overly ambitious that they pushed the market above the $1.50 price level in just four days, they gave the sign that there is the possibility that the general trend may reverse soon. During those periods of hyper-bullishness, the Bollinger Bands pointed to the increasing volatility as a result of the strong pump in price. But the bearish trend that was triggered at the $1.53 price level is fading off at $1.29 as the market has remained flat around this level for a couple of days. In today’s market, although bearish activities can still be felt in the market, we see the trend of the market turning to the upside.
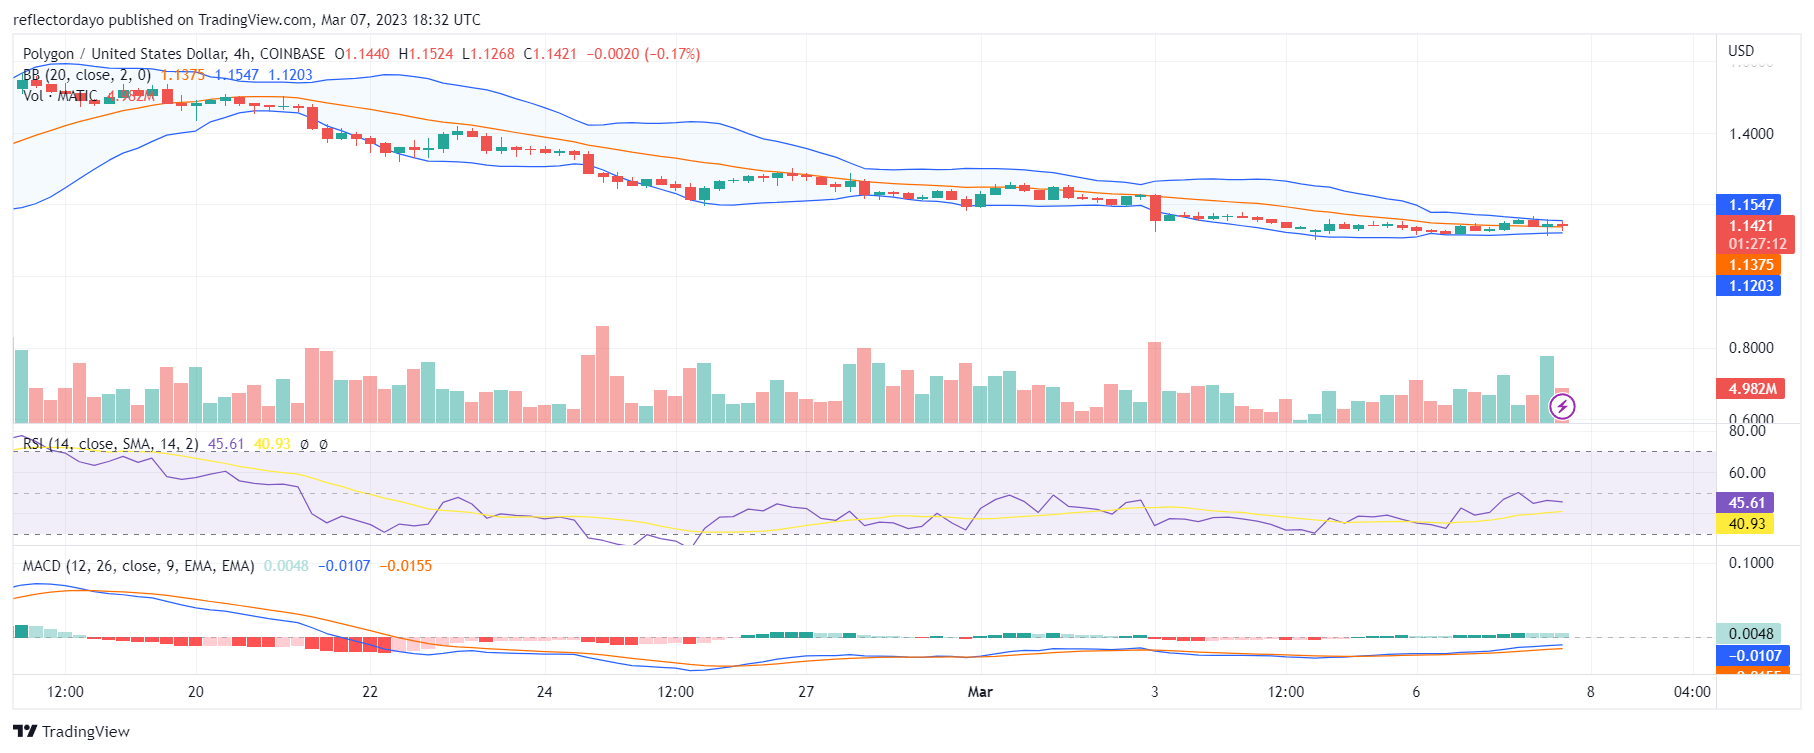
MATIC/USD 4-Hour Chart Outlook
From this point of view on the market, we see the market going flat at around $1.138. The Bollinger Bands indicator shows the market moving along with the 20-day moving average and the converging bands signifying the deadlock situation in the market reaching a climax of which we should expect the breakout of a decisive market movement to follow. There is the possibility that the breakout will be to the upside as the support level is strong.