Render Token (RNDR/USD) Seeks to a Launch Pad at $8.00 Price Level
Estimated Reading Time: 3 minutes
Don’t invest unless you’re prepared to lose all the money you invest. This is a high-risk investment and you are unlikely to be protected if something goes wrong. Take 2 minutes to learn more
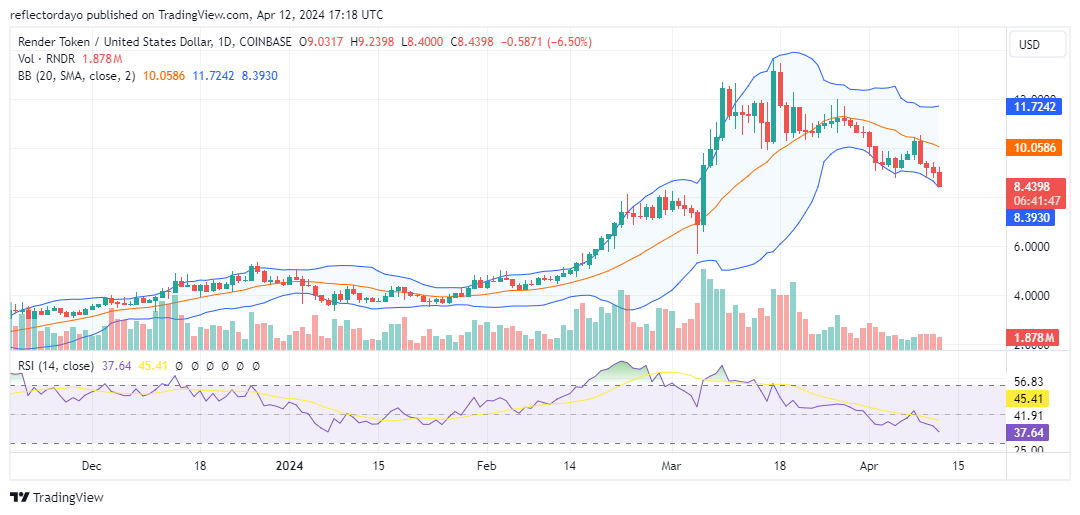
After the Render token bulls were unable to maintain a position above the $10.00 price threshold, the chart indicates a decline, breaching the support level at $9.19 and descending toward the critical support level at $8.00. At this juncture, there exists the potential for a price rally, given that this level previously served as a resistance point asserted by bulls and could now function as a new support level.
Render Token Market Data
- RNDR/USD Price Now: $8.44
- RNDR/USD Market Cap: $3.2 million
- RNDR/USD Circulating Supply: 381 million
- RNDR/USD Total Supply: 532 million
- RNDR/USD CoinMarketCap Ranking: #40
Key Levels
- Resistance: $10.50, $11.00, and $12.00.
- Support: $8.00, $7.50, and $7.00.
Render Token Market Analysis: The Indicators’ Point of View
In early March, bullish activity intensified, propelling the price significantly from around the $7.40 level. This surge broke numerous resistance barriers, culminating in a peak above $12.00 within a matter of days. While a strong bearish response might have been anticipated, market dynamics were balanced, resulting in a temporary equilibrium between demand and supply within the $10 and $11 price ranges. Shortly thereafter, the market began to decline below the $10 threshold.
Observing attempts by bulls to revive the market at $9.19, a subsequent rally ensued, yet it faltered in the face of mounting bearish sentiment around the $10 level, formerly a support zone. Presently, the market is trending toward $8.00. The Bollinger Bands continue to depict significant market volatility. However, the failure of bulls to reclaim the $10 mark indicates waning bullish sentiment, while the descending price reflects increasing bearish momentum.
It is hoped that the market will consolidate around $8.00, potentially heralding a forthcoming rally.
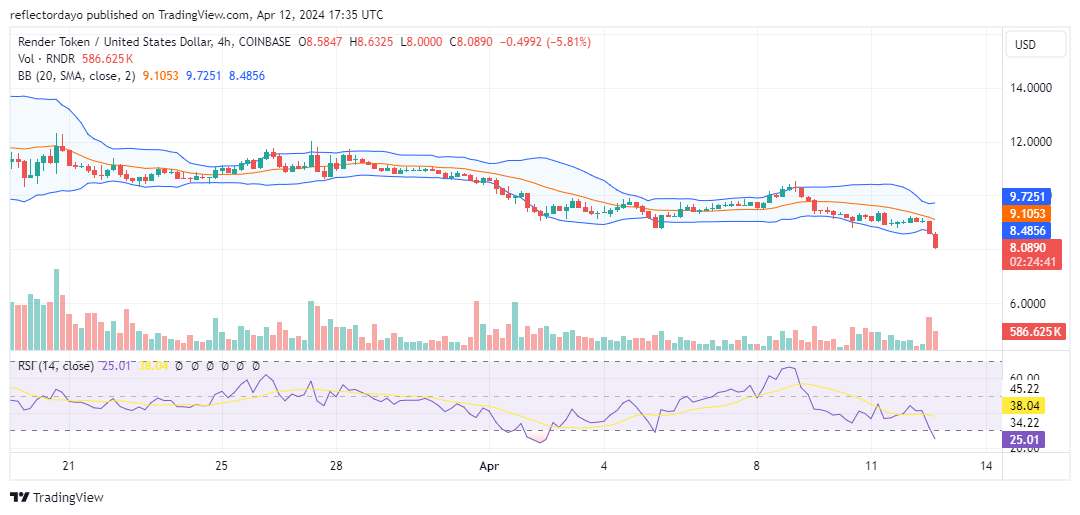
RNDR/USD 4-Hour Chart Outlook
From a shorter timeframe perspective, the market appears to be moving sideways, albeit with occasional bearish shifts below previous levels. This consolidation suggests underlying bullish sentiment within the market. Traders may be exercising patience, awaiting a significant crypto signal—a price level breach at the $8.00 price level—before entering the market, potentially triggering a rally in prices.