Rocket Pool (RPL/USD) Surges as Bullish Momentum Takes Over
Estimated Reading Time: 3 minutes
Don’t invest unless you’re prepared to lose all the money you invest. This is a high-risk investment and you are unlikely to be protected if something goes wrong. Take 2 minutes to learn more

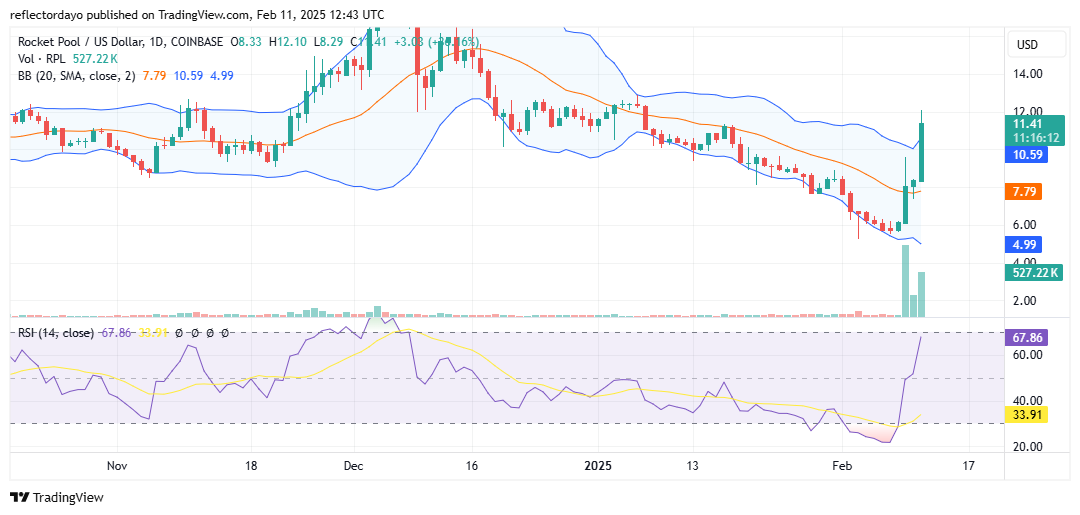
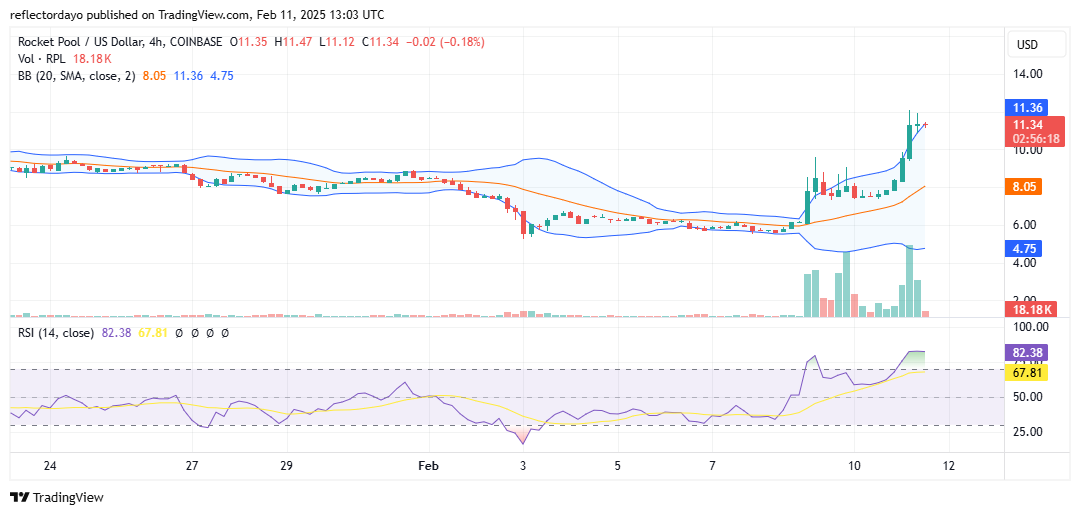
Rocket Pool (RPL) has been on a downward trajectory since early February. The price action steadily declined until it reached the $6.00 level, where it found strong support. At this point, buying interest increased as traders rushed to capitalize on the dip, triggering a sharp rebound.
Over the past three days, the market has continued its upward surge, gaining momentum until reaching the $12.00 level. At this resistance zone, a minor price correction appears to be unfolding. However, the bullish candlestick formation suggests that long-term traders may still see potential for further gains.
That said, the $12.00 level could also attract increased bearish sentiment, potentially leading to further pullbacks. For a more in-depth analysis, let’s examine key technical indicators.
Rocket Pool Market Data
- RPL/USD Price Now: $11.42
- RPL/USD Market Cap: $238 million
- RPL/USD Circulating Supply: 21 million RPL
- RPL/USD Total Supply: 21 million RPL
- RPL/USD CoinMarketCap Ranking: #194
Key Levels
- Resistance: $12.00, $13.00, and $14.00
- Support: $6.00, $5.00, and $4.00.
The Rocket Pool Market Through the Lens of Indicators
A significant price surge over the past three days has noticeably increased market volatility. After reaching the $12.00 level, bearish pressure may intensify, potentially leading to a strong correction as sellers attempt to regain control.
According to the Bollinger Bands indicator, the Rocket Pool price has pushed beyond the upper band, signaling overbought conditions. Similarly, the Relative Strength Index (RSI) has risen sharply, indicating that a crypto signal correction may follow.
However, in the event of a pullback, the strong bullish momentum suggests that buyers could establish higher support levels. Bulls may attempt to defend the $10.00 level, using it as a springboard for another upward move.
RPL/USD Price Prediction: 1-Hour Chart Analysis
After reaching the $12.00 level, bullish momentum appears to be losing steam, with the price stabilizing around $11.36. A fierce battle between bulls and bears is unfolding as both sides struggle for control. While buyers are attempting to establish support at this level, the likelihood of sustaining it remains uncertain, as the market appears primed for a correction.
Analyzing the Relative Strength Index (RSI), the indicator is currently above 70 and consolidating around 82, signaling overbought conditions. This suggests that a deeper price correction may be on the horizon. If a pullback occurs, the next potential rebound zone could be the $10.00 support level.