Sandbox (SAND/USD) Bullish Recovery Faces Resistance at $0.150
Estimated Reading Time: 3 minutes
Don’t invest unless you’re prepared to lose all the money you invest. This is a high-risk investment and you are unlikely to be protected if something goes wrong. Take 2 minutes to learn more

After an extended period of bearish price action, Sandbox found strong support around the $0.108 level following a sustained downward trend. The emergence of bullish interest at this zone caused price action to stabilize and consolidate around this level.
More recently, a bullish recovery has begun to unfold in the market, signaling renewed buying momentum and suggesting that bulls are becoming more active. However, this recovery is now being challenged, as bearish pressure is starting to build around the $0.150 resistance level.
Sandbox (SAND/USD) Market Data
- SAND/USD Price Now: $0.142
- SAND/USD Market Capitalization: $371 million
- SAND/USD Circulating Supply: 2.6 billion SAND
- SAND/USD Total Supply: 3 billion SAND
- SAND/USD CoinMarketCap Ranking: #110
Geopolitical Tension Is Hurting the Crypto Market
Using Bitcoin as a representative example of broader crypto market conditions, we have recently witnessed a sharp and significant price decline. Bitcoin dropped from around $93,000 to the $90,000 level, reflecting heightened uncertainty driven by geopolitical tensions.
If downside volatility persists, Bitcoin may struggle to reclaim the $93,000 level. In that case, the next potential area where price could find support and attempt a rebound is around the $88,300 level.
Key Levels to Monitor
- Resistance: $0.150, $0.16, $0.17
- Support: $0.110, $0.100, $0.09
Sandbox Market Analysis: Technical Viewpoint
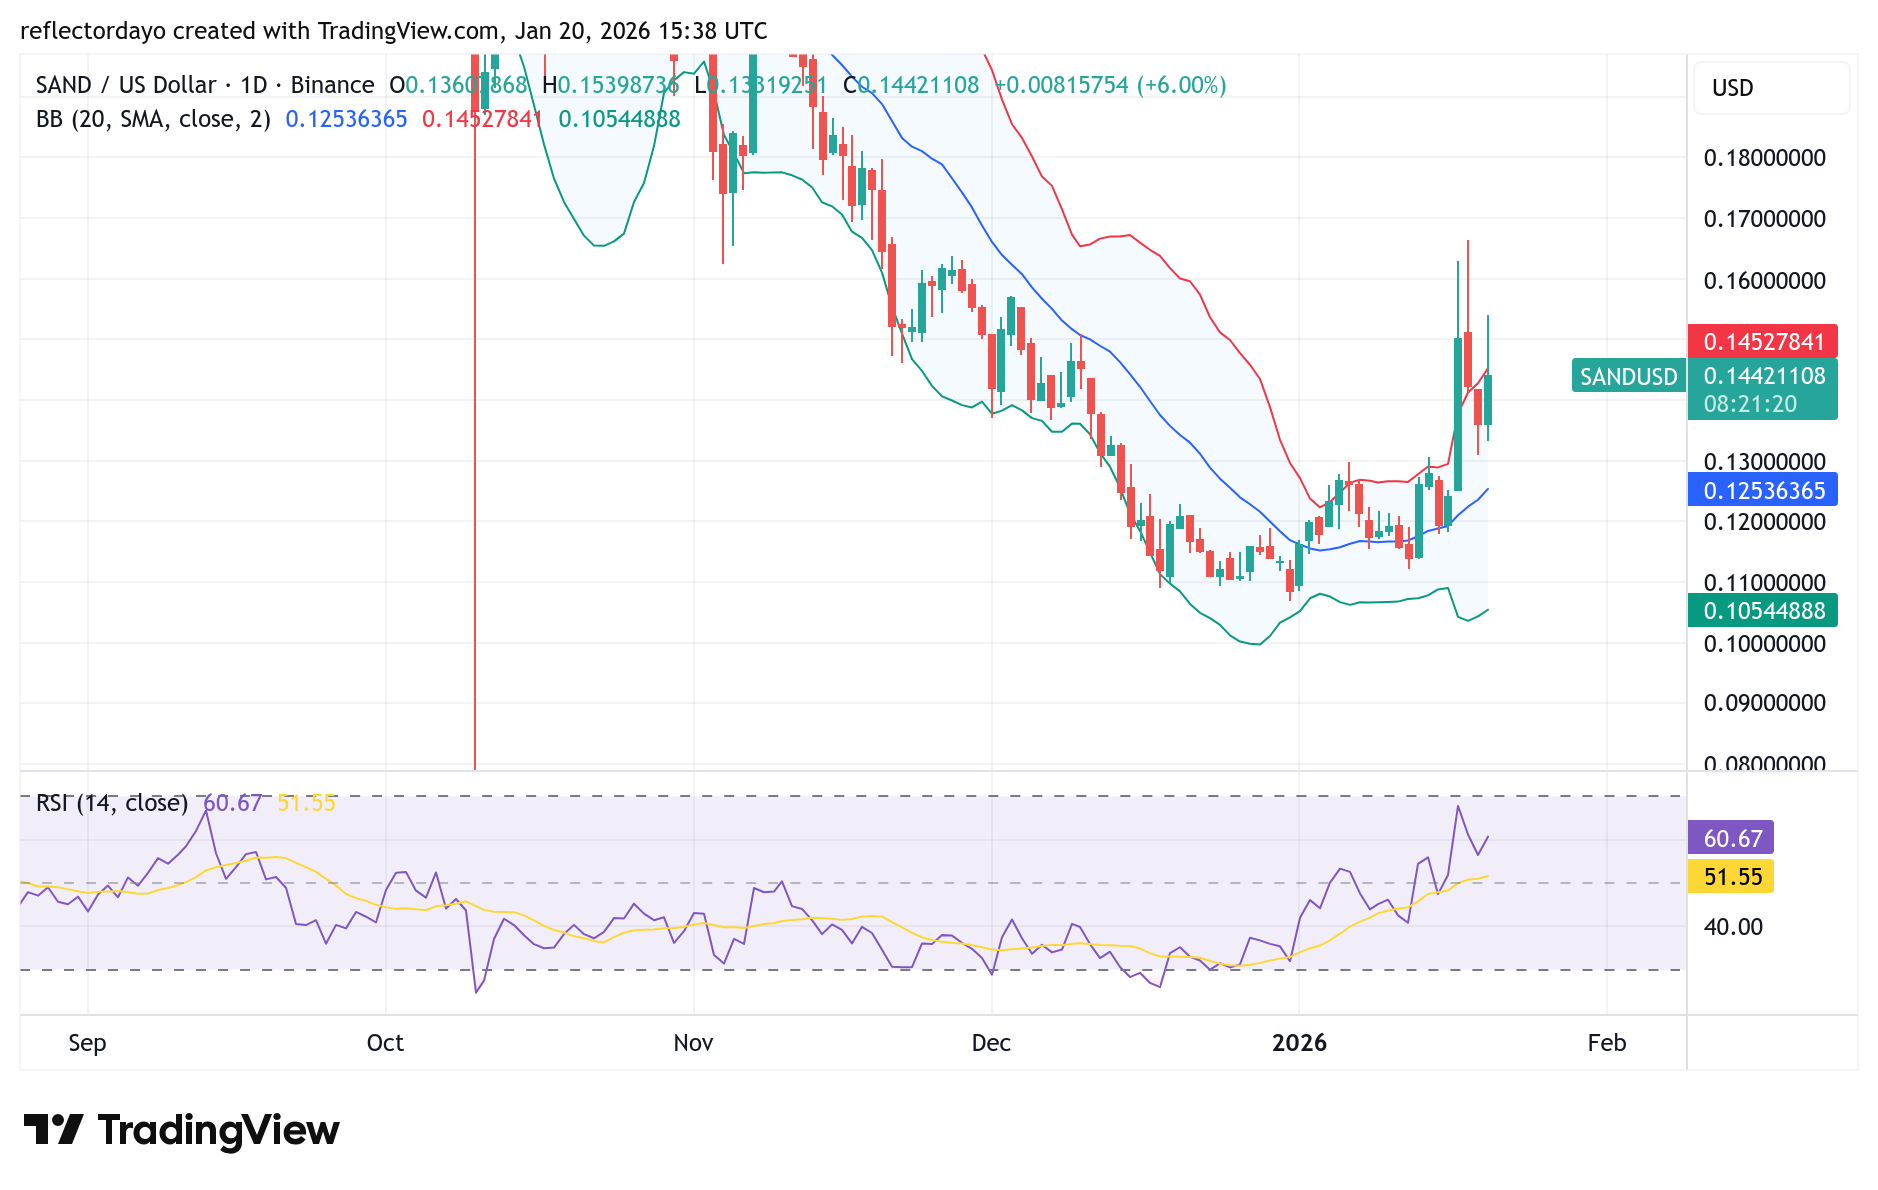
Between late last year and the beginning of this year, the market has been consolidating around the $0.10 price level. This prolonged consolidation suggests the emergence of a potential bullish recovery following the extended bear market that began around the $0.35 level in July.
Typically, after a long bearish phase, traders tend to accumulate around a key price zone, and this appears to be exactly what has occurred here. A bullish recovery has indeed begun to play out; however, the Sandbox market is now at a crossroads near the $0.150 level.
Although $0.150 has emerged as a key resistance and has consistently capped bullish advances for some time, bulls have recently found support around $0.134, a level in close proximity to this resistance. This development in the crypto signal indicates that buyers may still be willing to press for further upside. Nonetheless, bearish pressure remains firm at the $0.150 resistance zone.
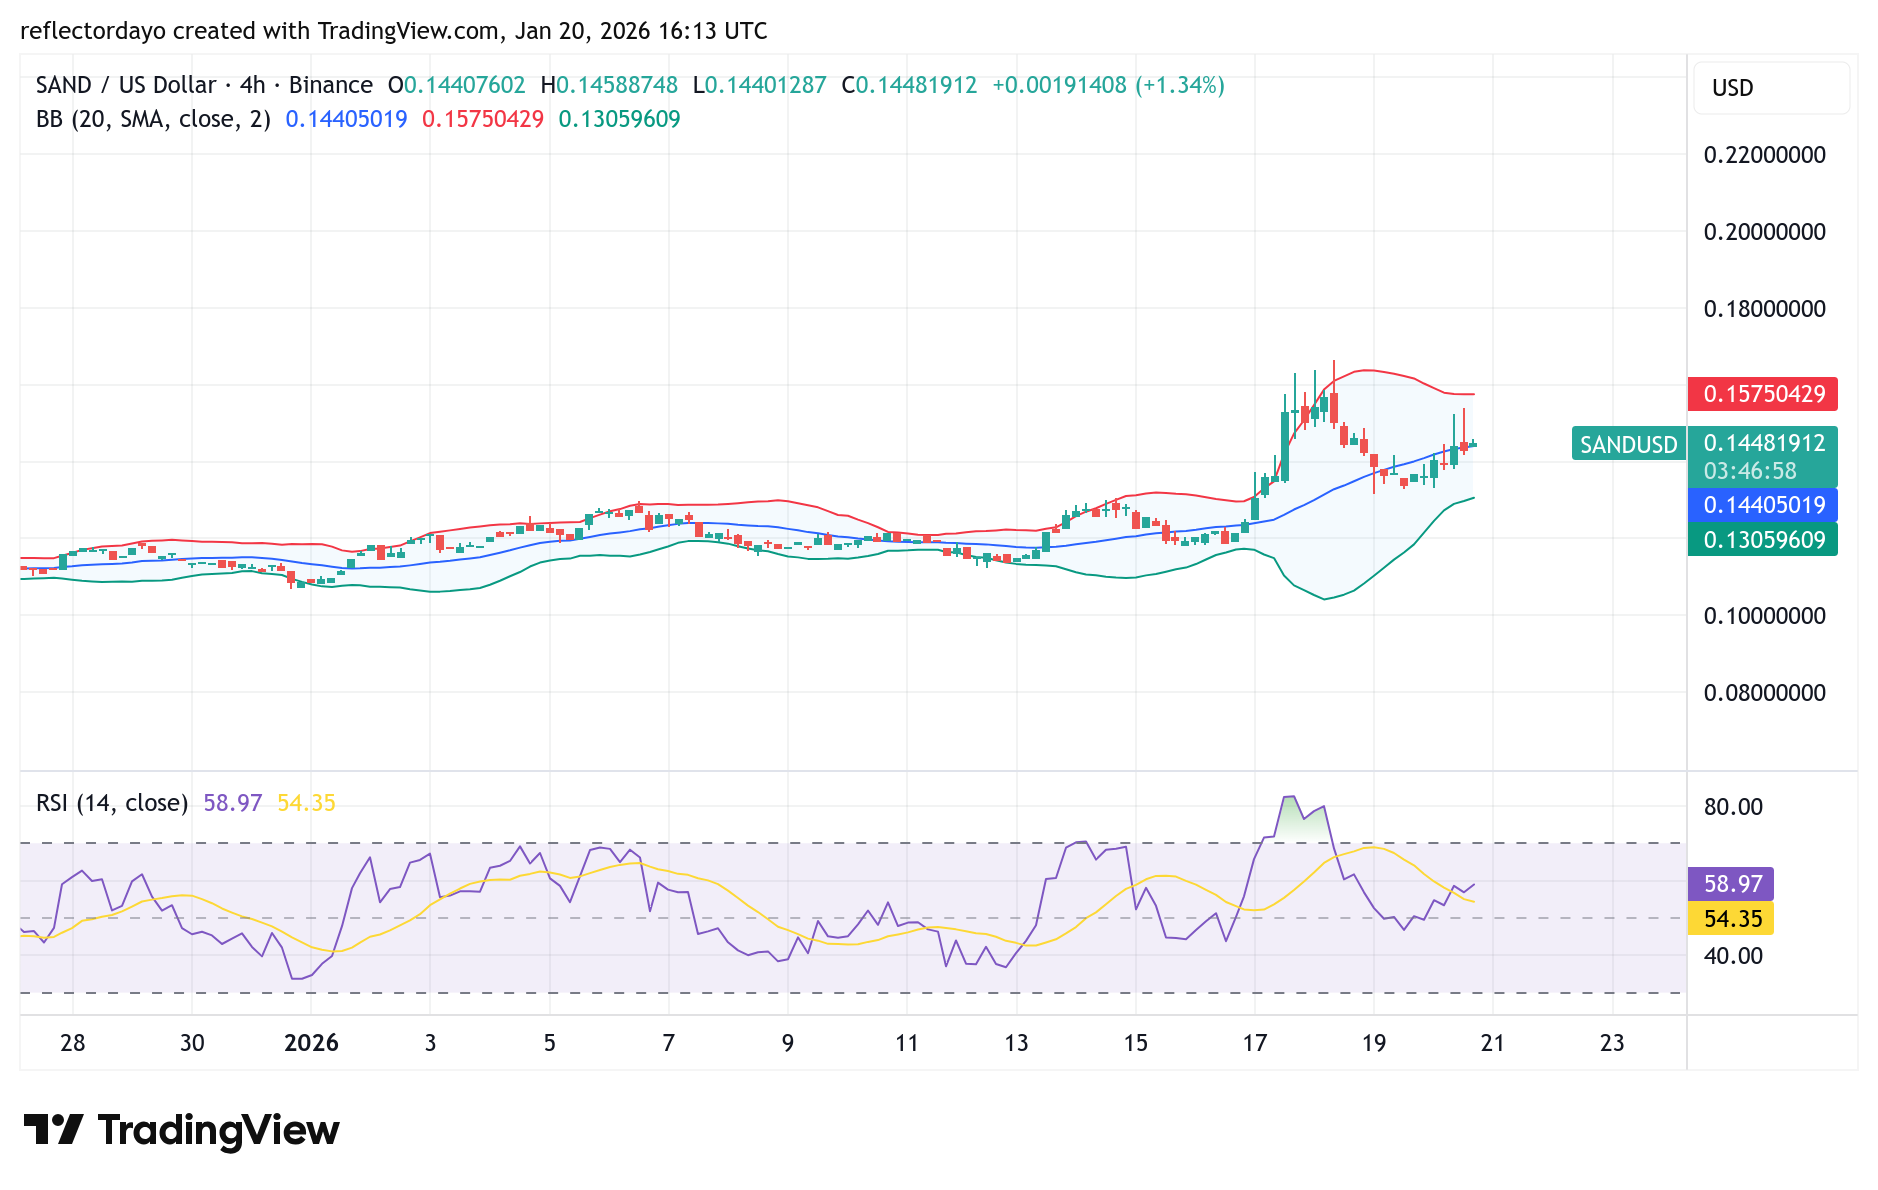
SAND/USD 4-Hour Chart Outlook
The earlier aggressive buying activity caused market volatility to spike. However, more recently, the Bollinger Bands have begun to converge, indicating a slowdown in volatility as both buyers and sellers firmly establish their positions around the $0.134 and $0.150 levels.
This convergence of the indicator suggests that the market may enter a period of consolidation before a potential continuation of the bullish recovery.