Sky (Prev. Maker) Bullish Momentum Capped at $0.06
Estimated Reading Time: 2 minutes
Don’t invest unless you’re prepared to lose all the money you invest. This is a high-risk investment and you are unlikely to be protected if something goes wrong. Take 2 minutes to learn more

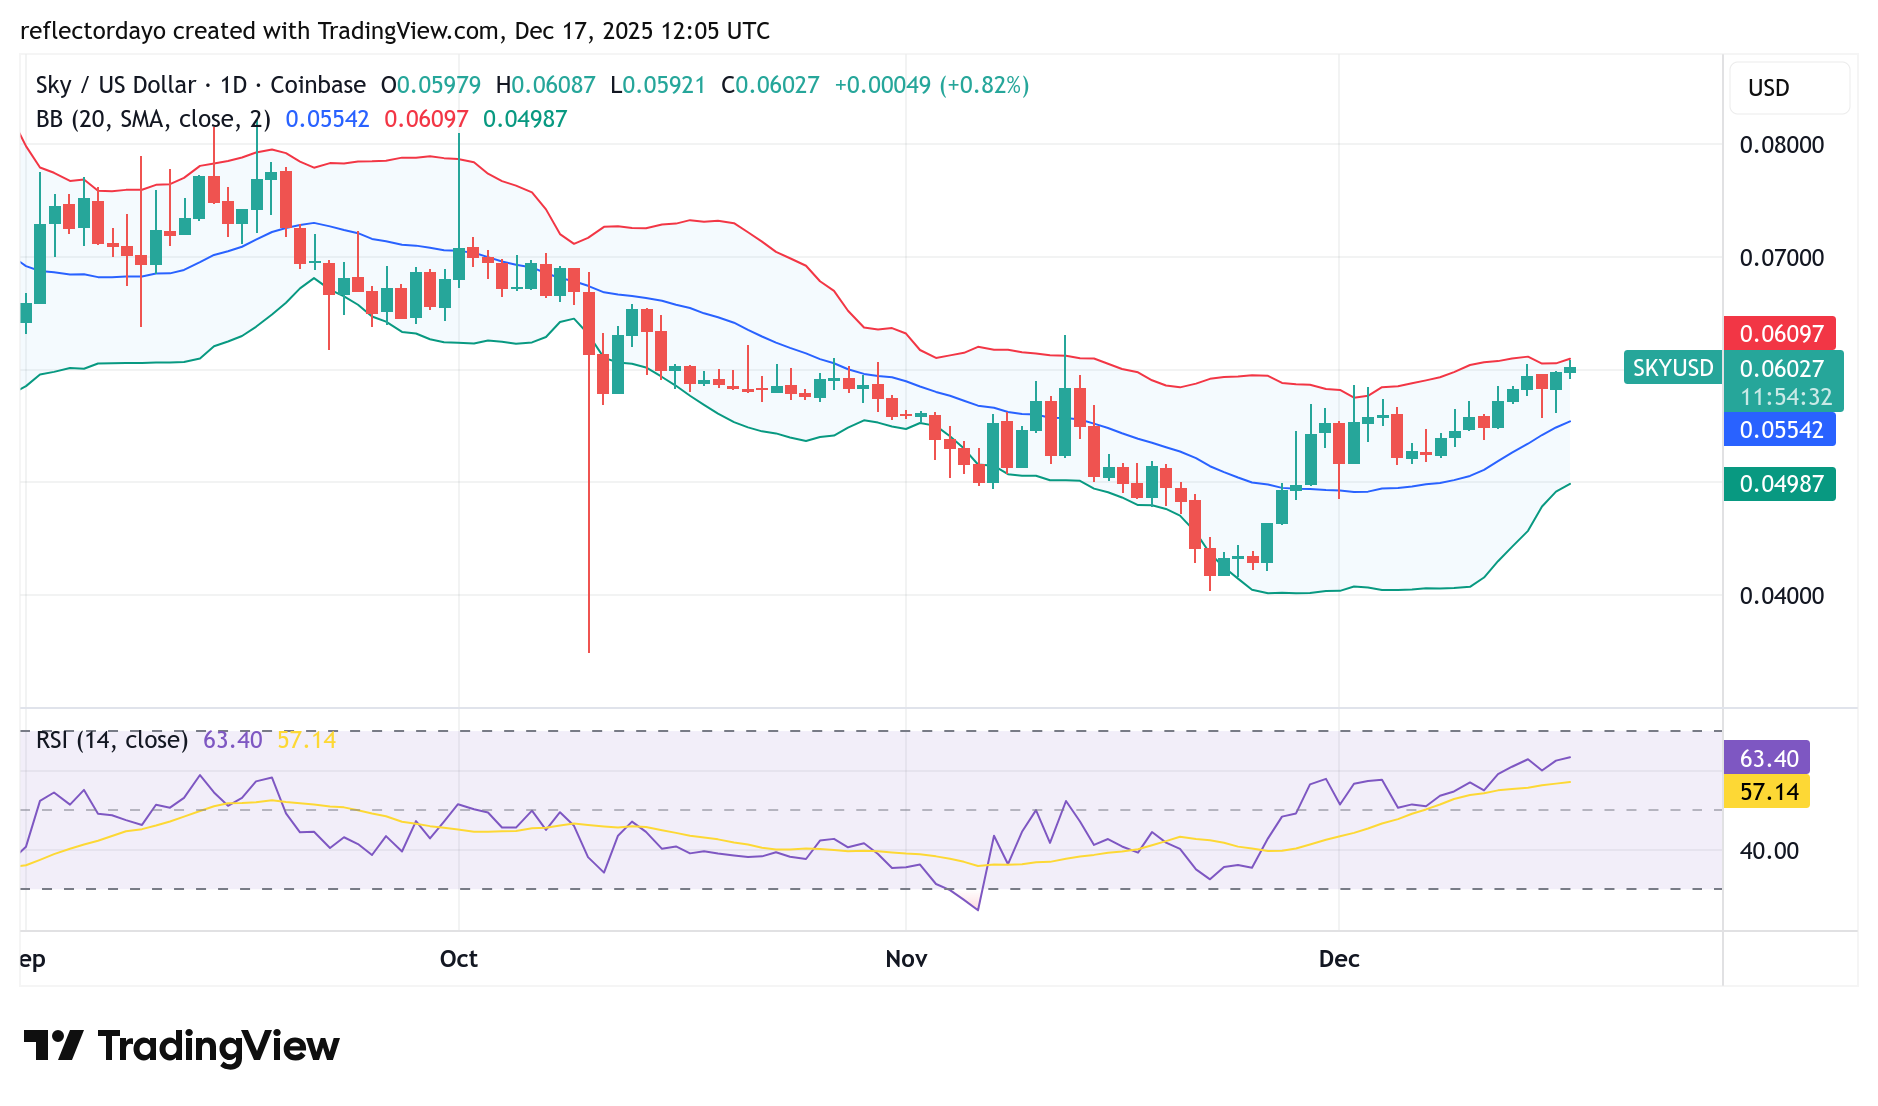
Between late October and early November, price broke to the downside after repeatedly failing to clear the $0.06 resistance level. Following this rejection, Sky (prev. Maker) experienced intensified downside volatility, indicating that bearish momentum had gained strong traction.
However, bulls stepped in around the $0.04 support level, triggering a sharp rebound back toward $0.06. While this recovery reflected strong bullish participation, upside momentum ultimately stalled at the $0.06 level, where selling pressure once again emerged in the crypto signal and capped further gains.
Sky (Prev. Maker) (SKYUSD) Market Data
- SKY/USD Price Now: $0.06
- SKY/USD Market Capitalization: $1.4 billion
- SKY/USD Circulating Supply: 22.9 billion SKY
- SKY/USD Total Supply: 23.5 billion SKY
- SKY/USD CoinMarketCap Ranking: #49
Key Levels to Watch
- Resistance: 0.065, $0.070, $0.075
- Support: $0.055, $0.050, $0.045
Sky (Prev. Maker) (SKY/USD) Daily Chart Analysis
From the perspective of the Bollinger Bands, Sky (prev. Maker) has formed an interesting structure, with price action flattening around the $0.06 level. This behavior highlights the strength of bearish pressure at this zone, as sellers have consistently managed to keep the price capped below the resistance.
However, if bulls are able to establish a near-term support base below $0.06, potentially around the $0.055 level, buying pressure could gradually build. Sustained support in this region may enable bulls to challenge the $0.06 resistance more effectively and potentially push the price toward the $0.07 target.
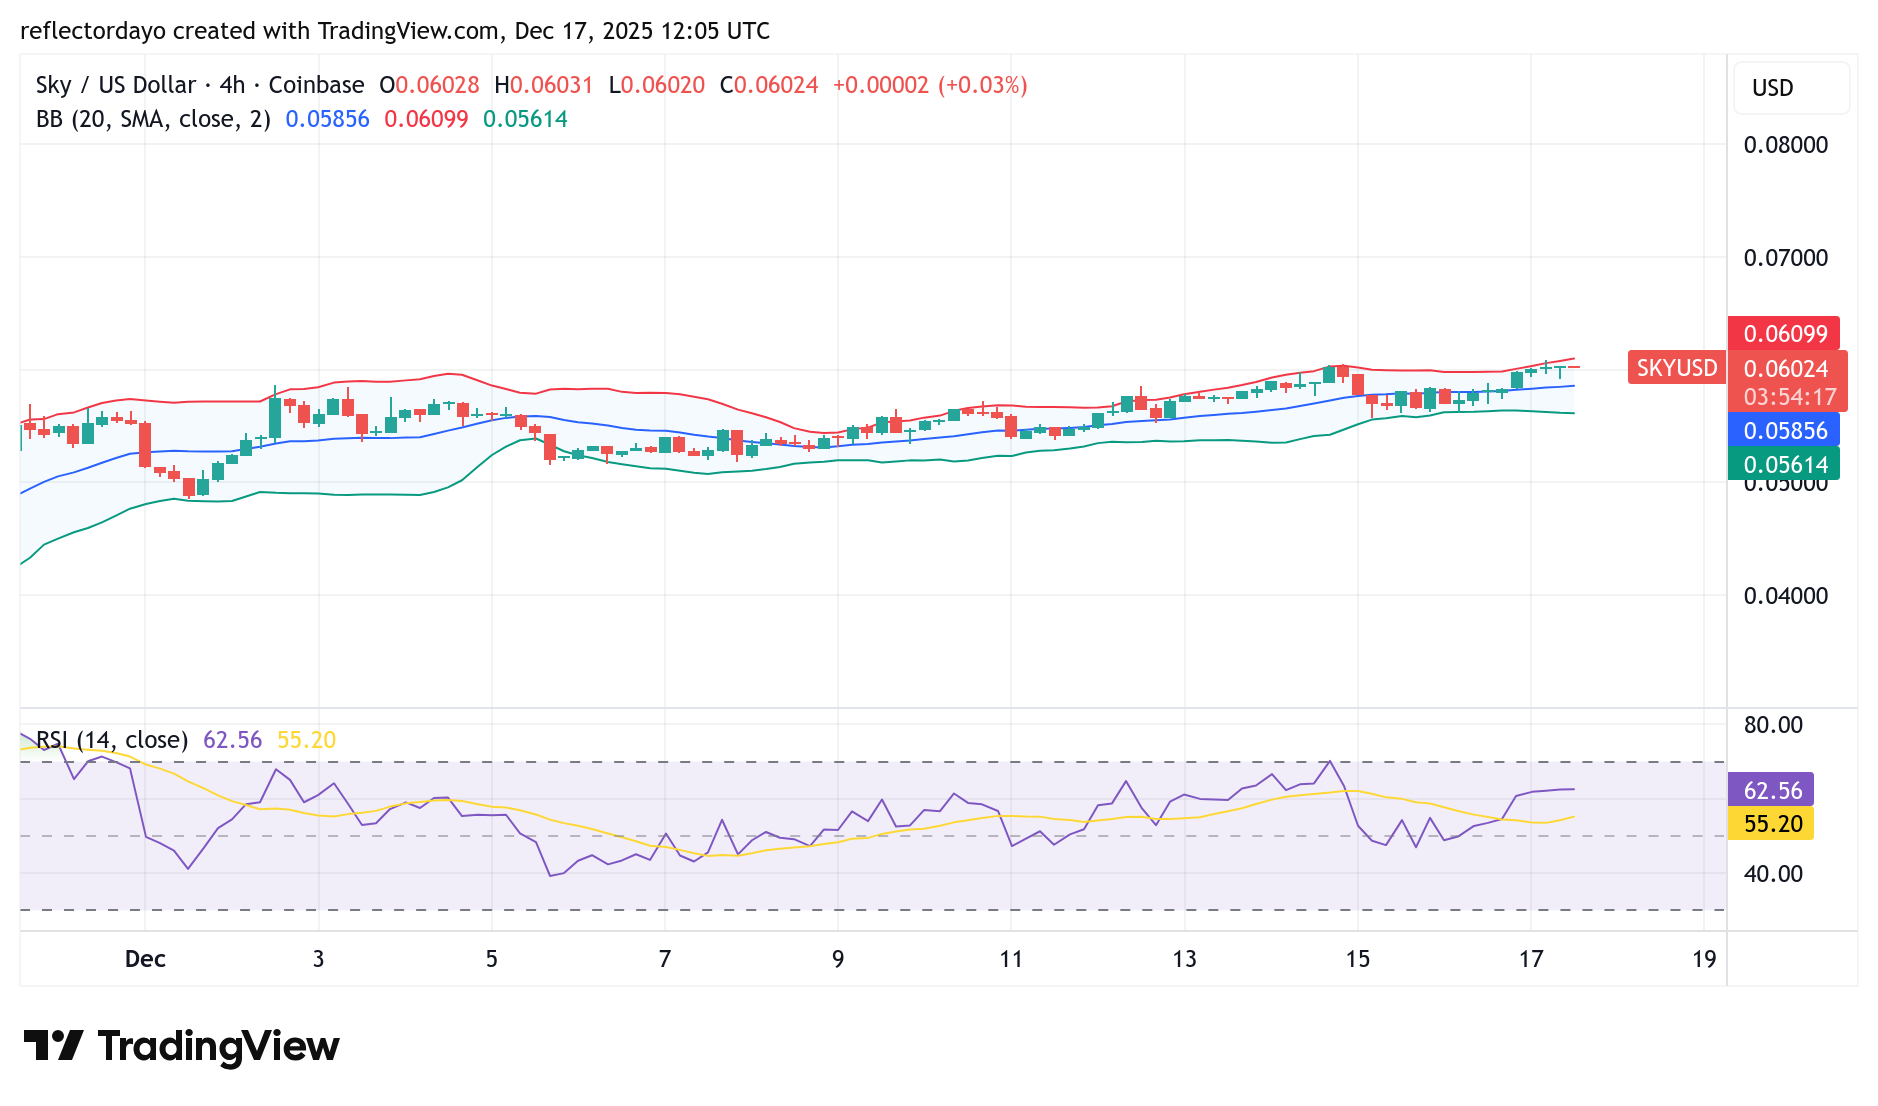
SKY/USD 4-Hour Chart Outlook
Scaling down to a lower timeframe, such as the 4-hour chart, the market’s upward move remained relatively consistent until bullish momentum encountered resistance near the $0.06 level. A closer look reveals potential support zones at $0.058 and $0.056.
If bulls are able to hold the price above either of these support areas, buying pressure could increase, potentially enabling another challenge of the $0.06 resistance level.