Solana (SOL/USD) Faces Test at Key Resistance Level: Can Bulls Break Through?
Estimated Reading Time: 2 minutes
Don’t invest unless you’re prepared to lose all the money you invest. This is a high-risk investment and you are unlikely to be protected if something goes wrong. Take 2 minutes to learn more
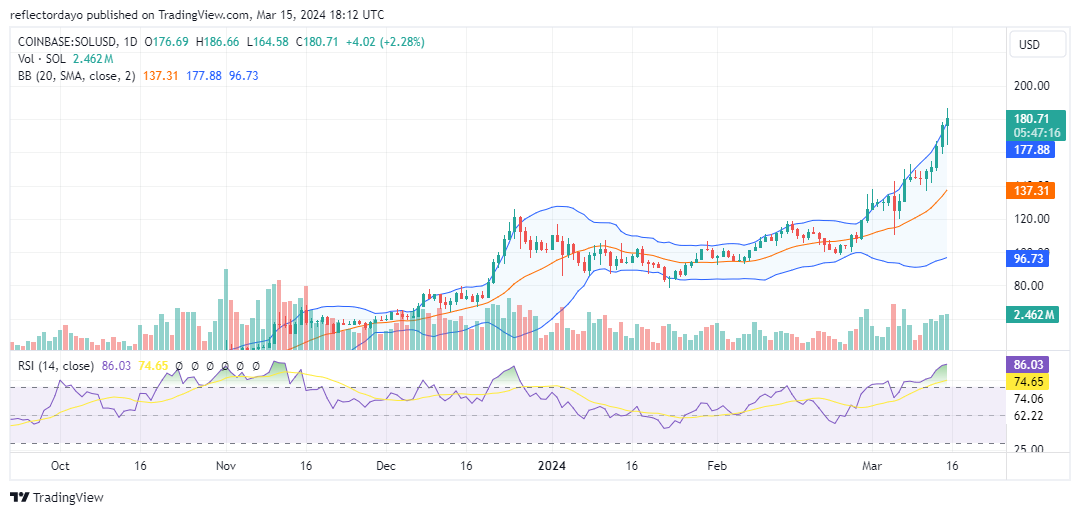
Solana‘s bullish run continues, but so does market volatility. This has bolstered bearish sentiment at key resistance levels, as evidenced by the previous struggle at $150. While technical indicators initially suggested a price correction, a surge in bullish sentiment propelled the price past $150, effectively converting it into support. This positive momentum has fueled further price increases.
Solana Market Data
- SOL/USD Price Now: $177
- SOL/USD Market Cap: $78.6 billion
- SOL/USD Circulating Supply: 443 million
- SOL/USD Total Supply: 571 million
- SOL/USD CoinMarketCap Ranking: #5
Key Levels
- Resistance: $180, $185, and $190.
- Support: $140, $135, and $130.
Solana Market Analysis: The Indicators’ Point of View
Despite the escalating volatility accompanying the market’s strong price surge, bears have yet to gain traction. There’s a possibility of a repeat of the March 12th scenario, where surpassing the $150 resistance attracted more bullish sentiment. However, relying solely on historical patterns can be misleading. Technical indicators still suggest a potential correction. Given the prevailing bullish crypto signal, a price intervention by bulls might occur around the $150–$160 range, potentially establishing a price channel where the demand-and-supply battle will unfold.
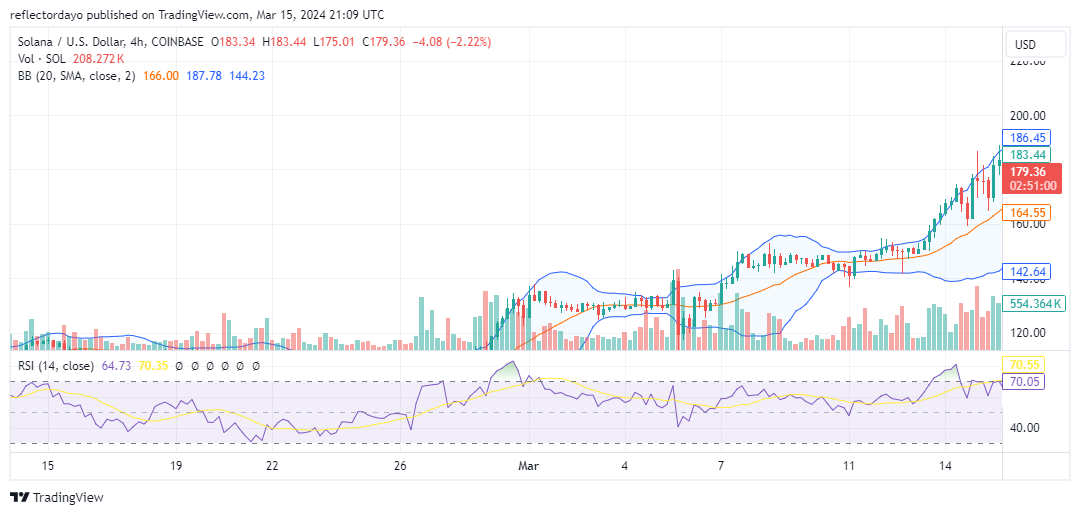
SOL/USD 4-Hour Chart Outlook
Traders may consider the Bollinger Bands on the 4-hour chart as a signal to adopt a wait-and-see approach. A sustained price above $180 for four trading sessions could indicate a continuation of the bullish trend. Conversely, failure to hold above $180 might lead to sideways price action until a clearer Solana market direction emerges.