Solana (SOL/USD) Overcomes Bearish Resistance, Set to Claim the $90 Price Level
Estimated Reading Time: 3 minutes
Don’t invest unless you’re prepared to lose all the money you invest. This is a high-risk investment and you are unlikely to be protected if something goes wrong. Take 2 minutes to learn more
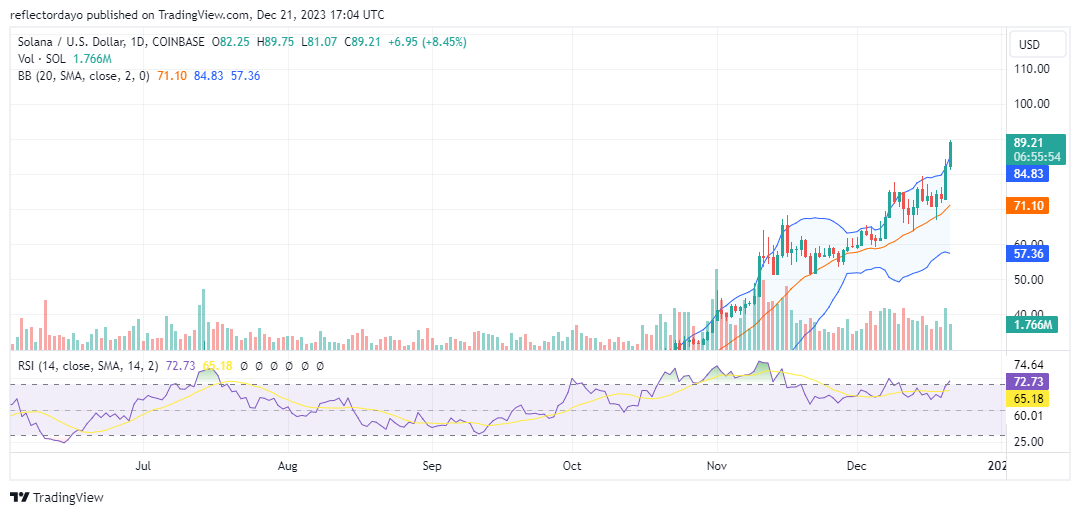
The Solana market has been on an upward trend since October. Notably, on December 8, the market reached a significant milestone, stabilizing around $72.58. This marked a breakout from the previous stalemate observed in daily sessions. Throughout the majority of yesterday’s trading session, the market exhibited bullish behavior. After comfortably surpassing the $80.00 mark, there was a brief moment when bearish traders initiated sell orders around the $84 price range. Nonetheless, the bullish momentum persisted, pushing the market closer to the $90 price point.
Solana Market Data
- SOL/USD Price Now: $88.87
- SOL/USD Market Cap: $37,997,837,060
- SOL/USD Circulating Supply: 427,338,517 SOL
- SOL/USD Total Supply: 565,385,248 SOL
- SOL/USD CoinMarketCap Ranking: #5
Key Levels
- Resistance: $92, $95, and $100.
- Support: $72, $68, and $63.
Solana Market Forecast: Analyzing the Indicators
The temporary consolidation around the $72 mark did not diminish the pronounced upward trend indicated by the Bollinger Bands, which commenced in October. By mid-November, the bull market had encountered significant resistance. Although there were concerns that the Solana market might shift bearishly after encountering this resistance, bullish traders maintained their position around the $60 price level. The bearish pressure failed to breach the $50 mark. By early December, the bulls had propelled the market to a new price tier. A comparable scenario appears to be unfolding between yesterday and today, potentially ushering the market into a new echelon.
Based on the Relative Strength Index (RSI), the market is currently teetering on the brink of overbought territory, suggesting potential room for further bullish activity. Throughout November and December, the market remained in the overbought zone, reflecting the prevailing bullish sentiment.
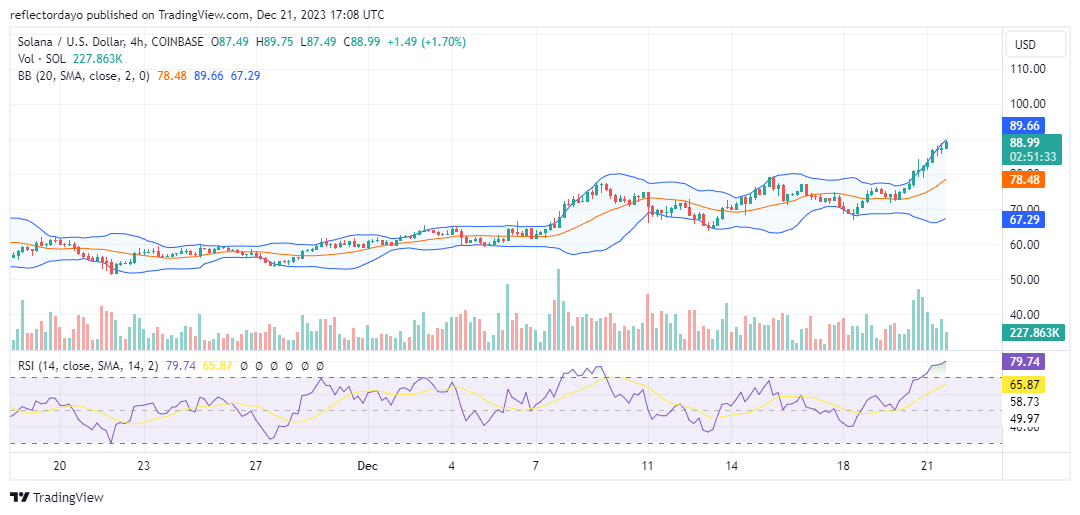
SOL/USD 4-Hour Chart Outlook
Upon examining the market through the 4-hour chart, the volume indicator is showing histograms with diminishing heights. Despite approaching the crucial $90 resistance level, there are no apparent signs of bearish resistance, suggesting the potential continuation of the bullish trend. However, the declining trade volume hints at the possibility of the market consolidating around the $90 mark before resuming its upward trajectory.