$SPONGE Analysis: A Pivotal Test at $0.00005 After Breakdown
Estimated Reading Time: 3 minutes
Don’t invest unless you’re prepared to lose all the money you invest. This is a high-risk investment and you are unlikely to be protected if something goes wrong. Take 2 minutes to learn more

Following a period of consolidation near $0.00007, the $SPONGE pair has succumbed to bearish pressure, declining sharply to test the significant $0.00005 support zone in today’s session (October 13). The daily chart formed a pronounced bearish marubozu, underscoring the sellers’ firm control.
Key Levels to Watch:
- Resistance: $0.000115, $0.000120, $0.000130
- Support: $0.000050, $0.000045, $0.000040
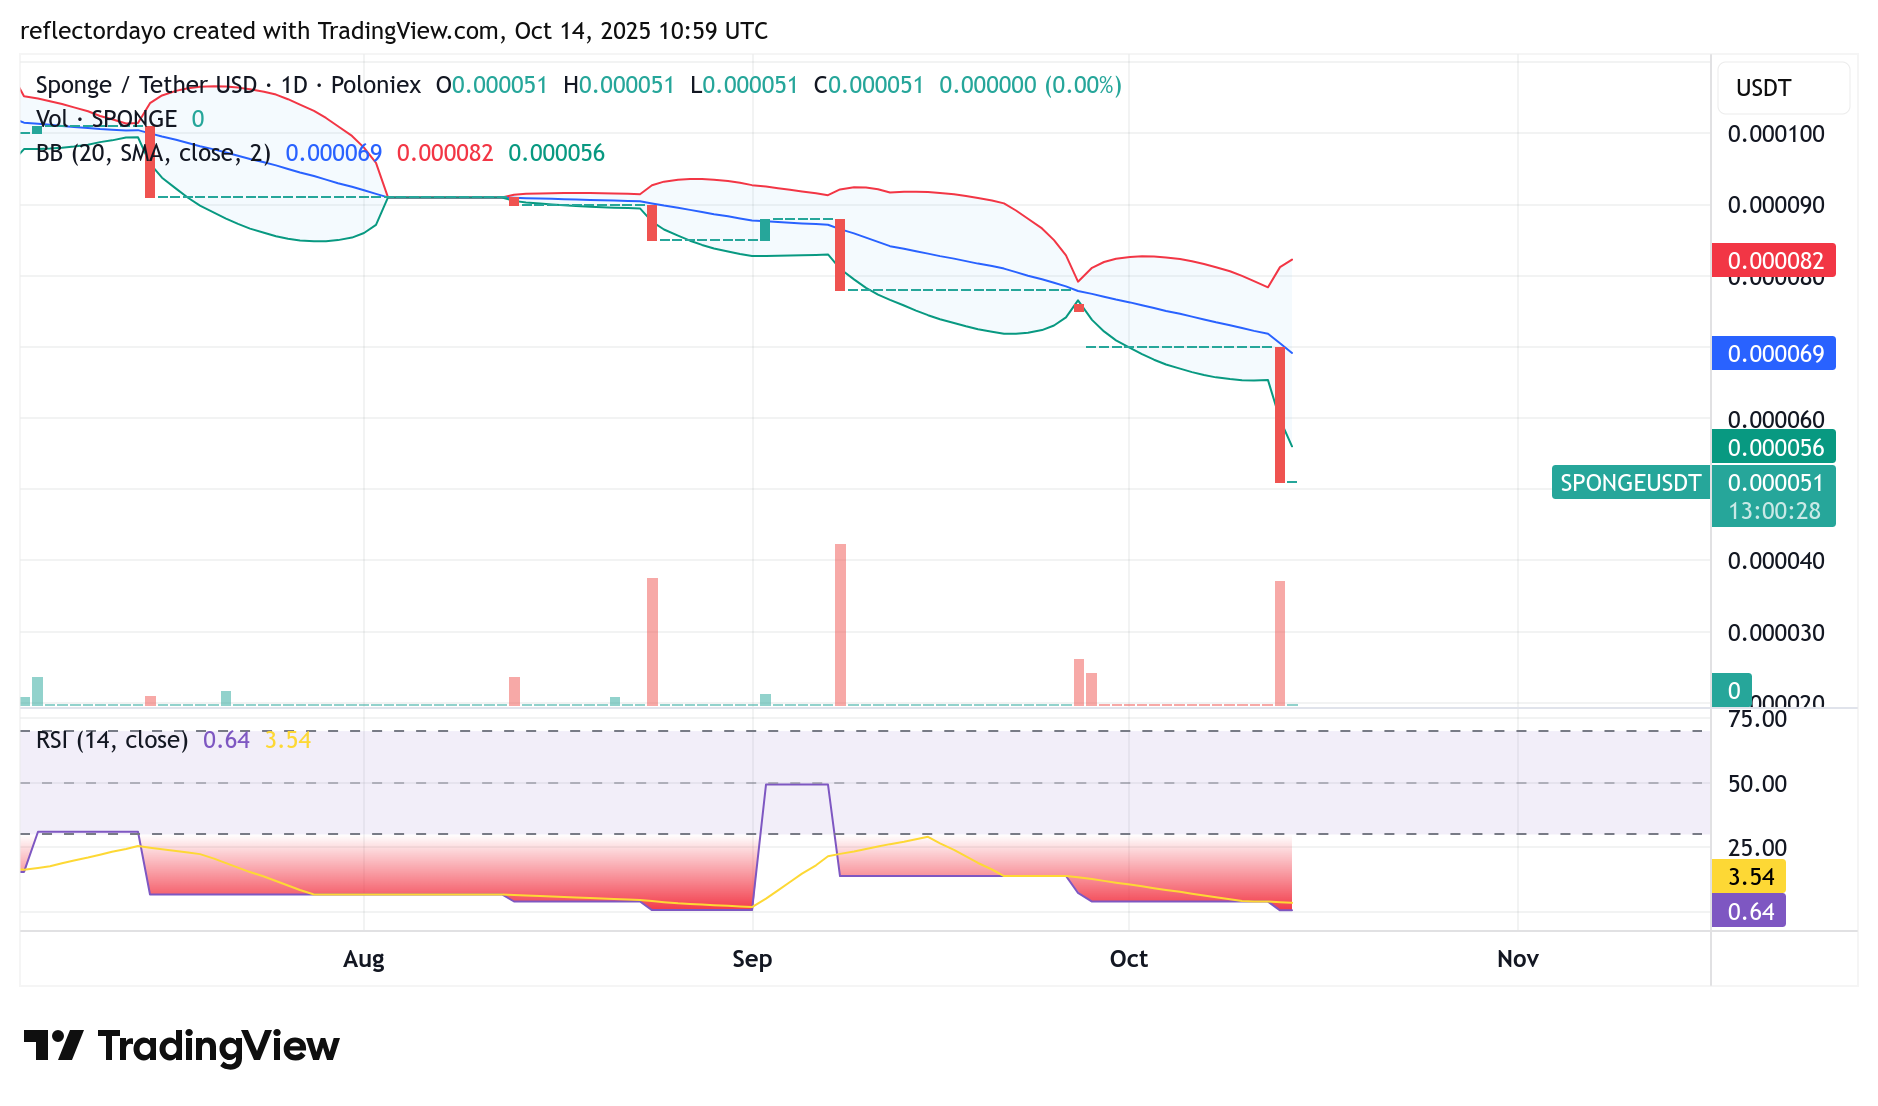
SPONGE/USD Daily Chart: Bullish Expectations May Converge at the $0.00005 Price Level
This descent toward $0.00005 represents a crucial inflection point, a level where the battle between fear and greed intensifies. Technically, this area is a historical support zone where $SPONGE buyer interest is expected to intensify, as value-seeking traders and long-term holders often see these depths as a strategic entry point. This collective action can create a “wall of bids,” potentially setting the stage for a meaningful recovery.
The expanding Bollinger Bands are critical here; they don’t just confirm a high-volatility environment—they signal that a powerful price expansion is underway. In such conditions, a successful defense of the $0.00005 support could trigger a violent short-covering rally. This means any bounce from this level has the potential to be swift and powerful, with enough momentum to quickly target the next significant technical hurdle at the $0.00008 resistance level.
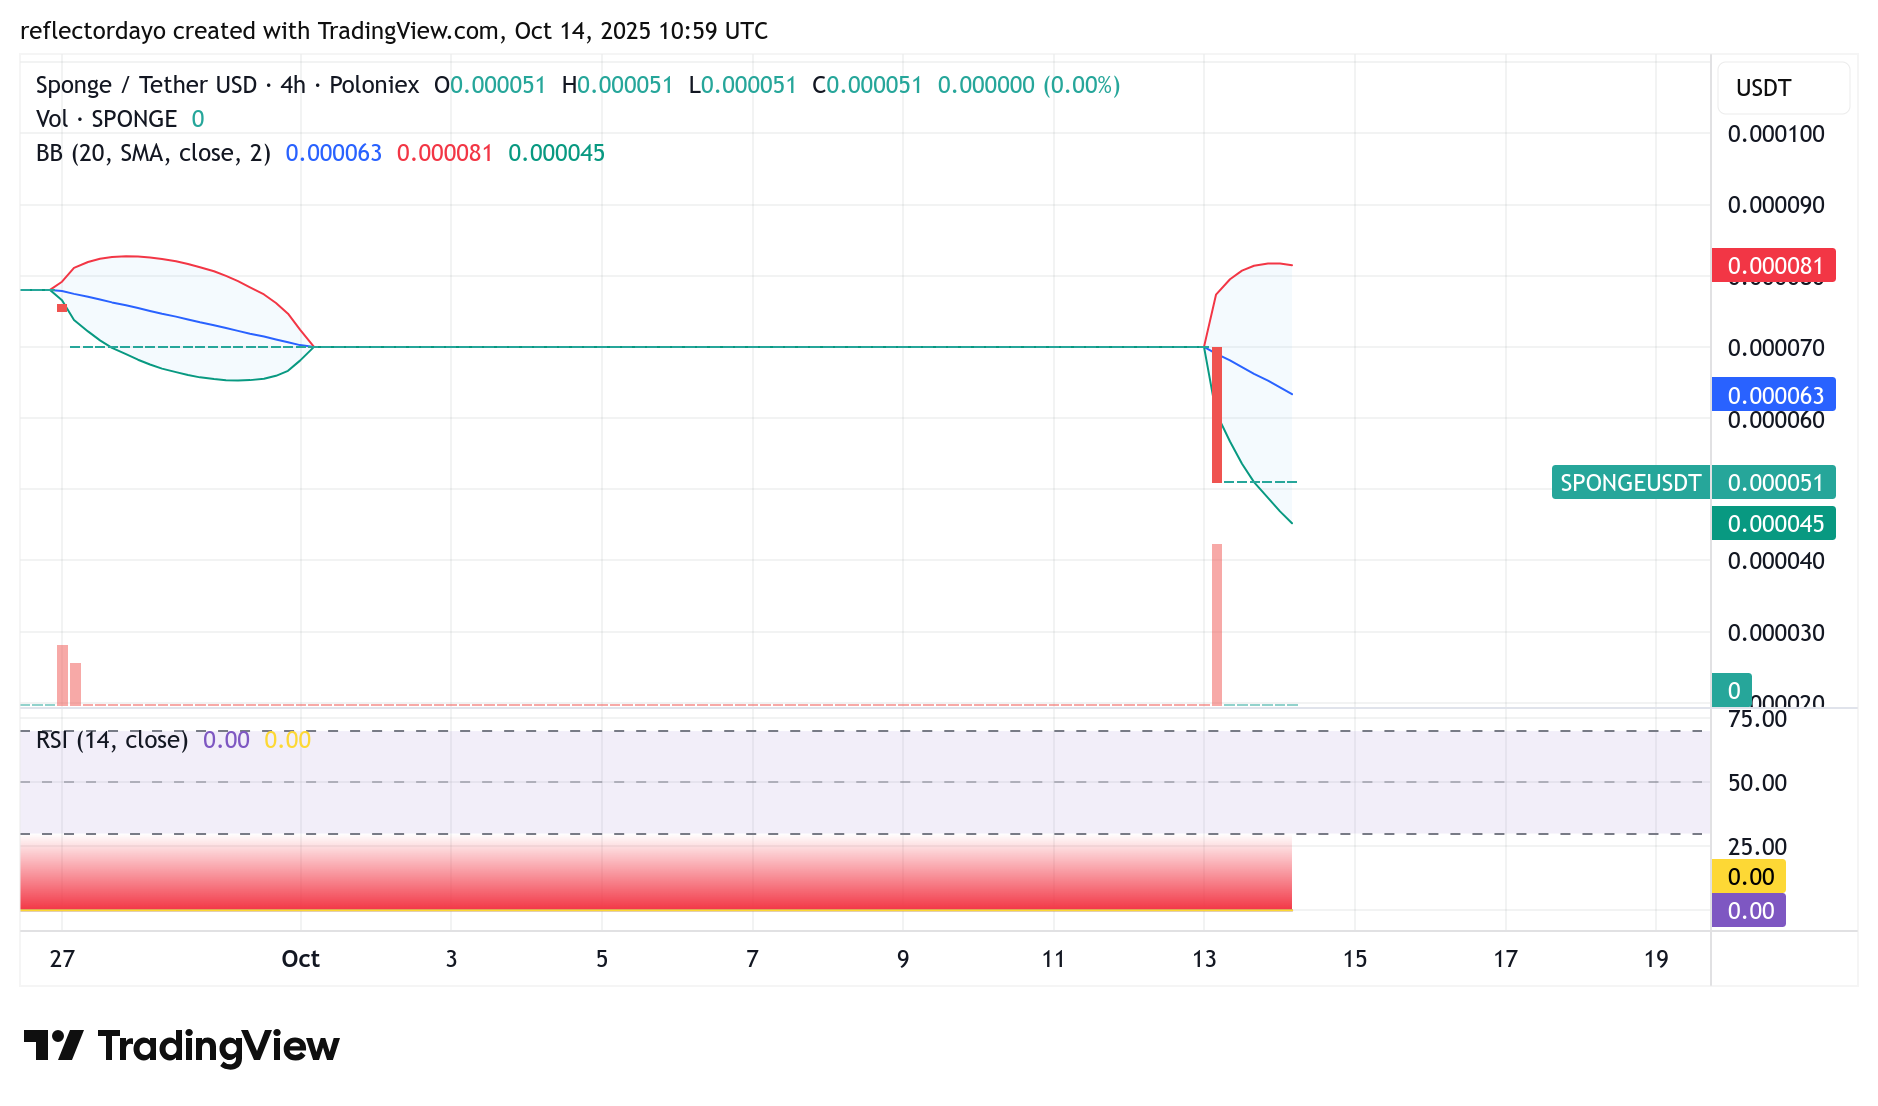
SPONGE/USD 4-Hour Chart Outlook
While the daily chart paints a bearish picture, a closer look at lower timeframes—like the 4-hour and 1-hour charts—reveals a potential shift in momentum. The Relative Strength Index (RSI) is currently approaching oversold territory (typically below 30). This is significant because it indicates that the selling pressure may be exhausting itself. If the RSI begins to curl upward or forms a higher low while the $SPONGE price itself makes a lower low, it would create a classic bullish divergence. This is a powerful technical signal that suggests underlying buying strength is forming even as the price continues to dip, providing a concrete basis for a potential trend reversal.
Buy $SPONGE!
Bears coping hard pic.twitter.com/ITA0Bkj4nj
— $SPONGE (@spongeoneth) October 11, 2025
Join the SPONGE community and get in on the next big crypto opportunity! Buy Sponge ($SPONGE) today