$SPONGE (SPONGE/USD) Analysis: Anticipated Bullish Intervention at $0.00033 Price Level
Estimated Reading Time: 2 minutes
Don’t invest unless you’re prepared to lose all the money you invest. This is a high-risk investment and you are unlikely to be protected if something goes wrong. Take 2 minutes to learn more
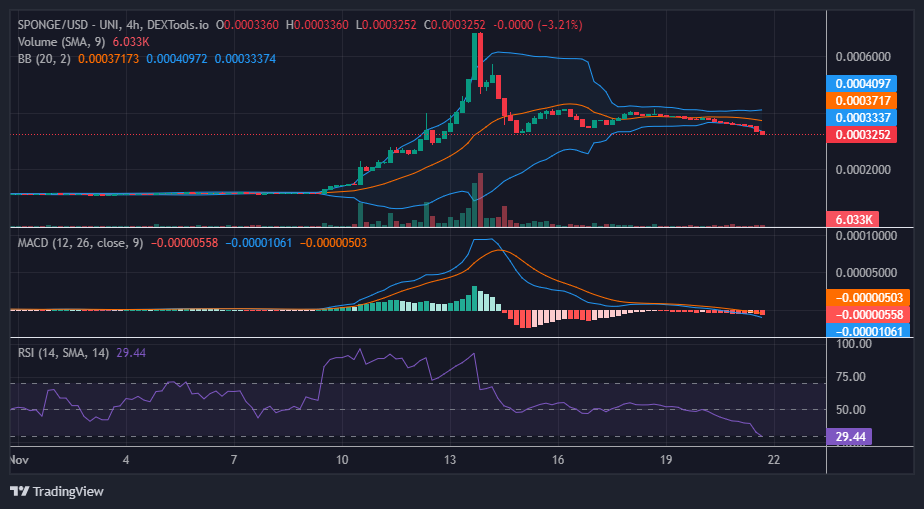
As of November 18, the market for $SPONGE has been marked by indecision, as evidenced by the prevalence of doji candlesticks. Despite this, a subtle downward trend is currently observed, signaling the initiation of downward movements by bearish traders. The gradual descent in the bear market, influenced by the sustained presence of bulls, is expected to pivot once it reaches the critical $0.00033 price threshold.
Technical Insights for $SPONGE (SPONGE/USD) Price Analysis:
Should the support level at $0.00033 prove insufficient to alleviate bearish pressure, the subsequent line of bullish defense may manifest at the $0.00030 price level. This level previously acted as a catalyst for the last $SPONGE bullish surge, propelling the market to its peak at $0.000700. Present readings from the Relative Strength Index (RSI) signal an oversold market, with market momentum measured at 29.44. This RSI reading has the potential to invigorate bullish sentiment.
Short-Term Outlook on the 1-Hour Chart:
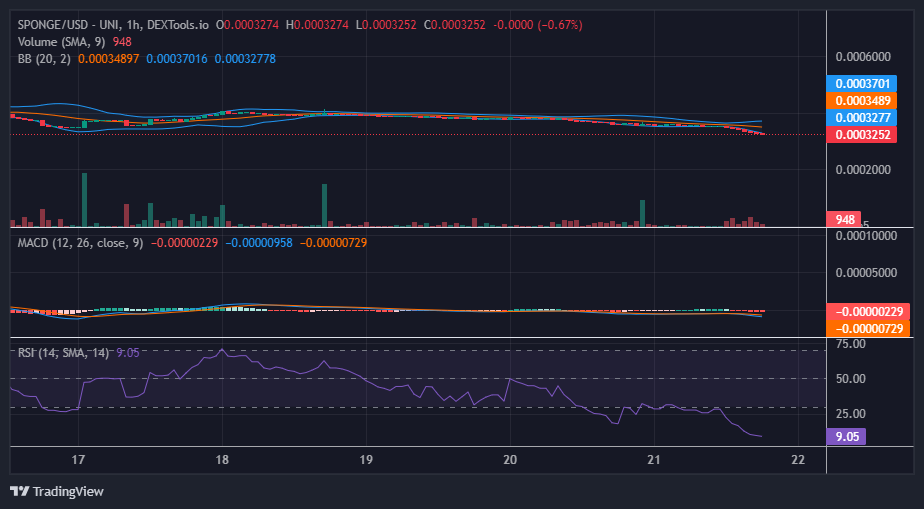
While the one-hour market perspective suggests a state of indecision, a broader timeframe reveals a discernible shift towards a subtle downtrend. Despite this, the RSI in this context indicates robust bearish momentum, even as actual candlestick patterns continue to convey indecision. The oversold market condition poses challenges to sustaining bullish sentiment.
Ride the following wave by grabbing the Sponge token.
Working in your 9-5 job waiting for the next #BullMarket 🧽🧽🔥🔥🚀🚀#Crypto #Web3 #MemeCoin #Alts pic.twitter.com/YDVwj7cWoc
— $SPONGE (@spongeoneth) November 20, 2023
Invest in the hottest and best meme coin. Buy Sponge ($SPONGE) today!