$SPONGE (SPONGE/USD): Bulls Dig In, Price Eyes Potential Launchpad
Estimated Reading Time: 2 minutes
Don’t invest unless you’re prepared to lose all the money you invest. This is a high-risk investment and you are unlikely to be protected if something goes wrong. Take 2 minutes to learn more

The $SPONGE market remains a battleground between bulls and bears. Our previous analysis highlighted support at $0.000038, but the price has clawed its way back up. However, the bears aren’t done yet – they’ve managed to nudge resistance down a notch from $0.000055 to $0.000051. While this might dampen bull spirits, a look at the indicators reveals a deeper story.
Key Market Dynamics:
- Resistance Levels: $0.0010, $0.0011, and $0.0012
- Support Levels: $0.000035, $0.000030, and $0.000025
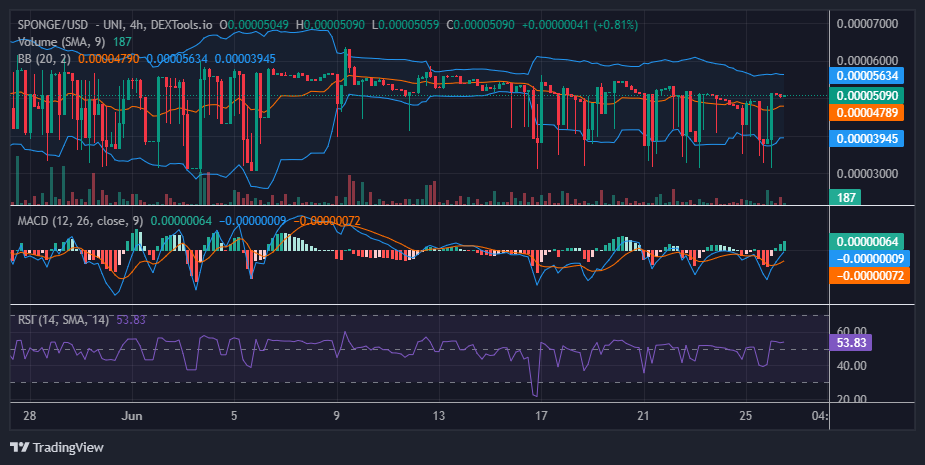
$SPONGE (SPONGE/USD) Technical Analysis Unveils Bullish Tenacity
The $SPONGE market might look stuck in neutral, but a closer inspection reveals a subtle shift. The bears have nudged resistance down slightly, suggesting a weakening grip. Here’s where it gets interesting: the Moving Average Convergence Divergence (MACD) indicator is telling a different story. It’s forming a bullish divergence, hinting that the bearish momentum might be fading. This suggests the price might be finding solace at current levels. Traders should be on the lookout for a potential bounce around $0.000050. If this level holds, it could be the launchpad for a significant upswing.
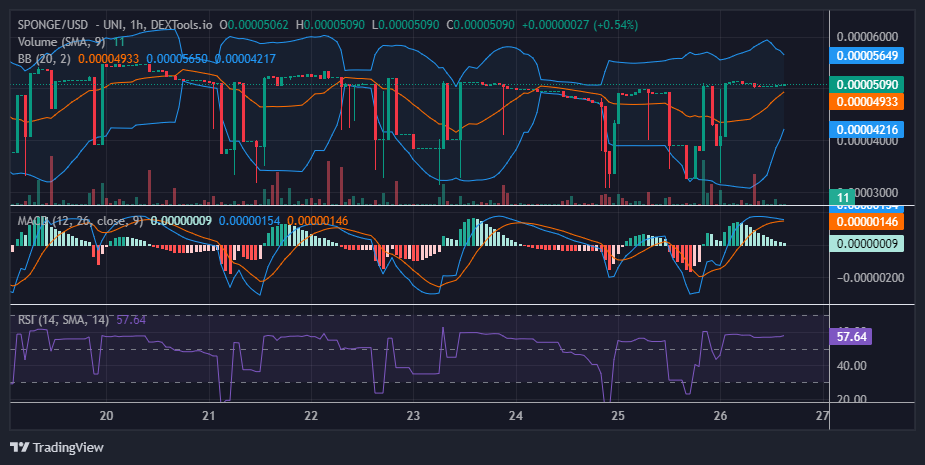
SPONGE/USD 1-Hour Chart Insights: Volatility, Friend or Foe?
One wrinkle in the bullish case is the Bollinger Bands, which indicate persistent market volatility. This volatility could disrupt the current bullish momentum. The key area to watch is around $0.000050. Here, the convergence of the Bollinger Bands suggests decreasing volatility, which could play into the bulls’ hands. Lower volatility often leads to consolidation, potentially solidifying the $0.000050 level as support and paving the way for a price jump.
Buy SPONGE/USD!
MOOD 🧽💦 pic.twitter.com/JIeWVTKGqp
— $SPONGE (@spongeoneth) June 26, 2024
Invest in the hottest and best meme coin. Buy Sponge ($SPONGE) today!