$SPONGE (SPONGE/USD) Bulls Eye a Rebound at $0.00004
Estimated Reading Time: 2 minutes
Don’t invest unless you’re prepared to lose all the money you invest. This is a high-risk investment and you are unlikely to be protected if something goes wrong. Take 2 minutes to learn more

Following the recent price surge that elevated the market to the $0.00005 level, the bull market showed signs of exhaustion, leading to a gradual decline in the price as the supply of SPONGE/USD started to exceed demand. Bullish traders are now looking at the $0.00004 level as a potential support zone to form a base for a significant price rebound.
Key Market Dynamics:
- Resistance Levels: $0.0010, $0.0011, and $0.0012.
- Support Levels: $0.000035, $0.000030, and $0.000025.
Delving into Technical Analysis for $SPONGE (SPONGE/USD)
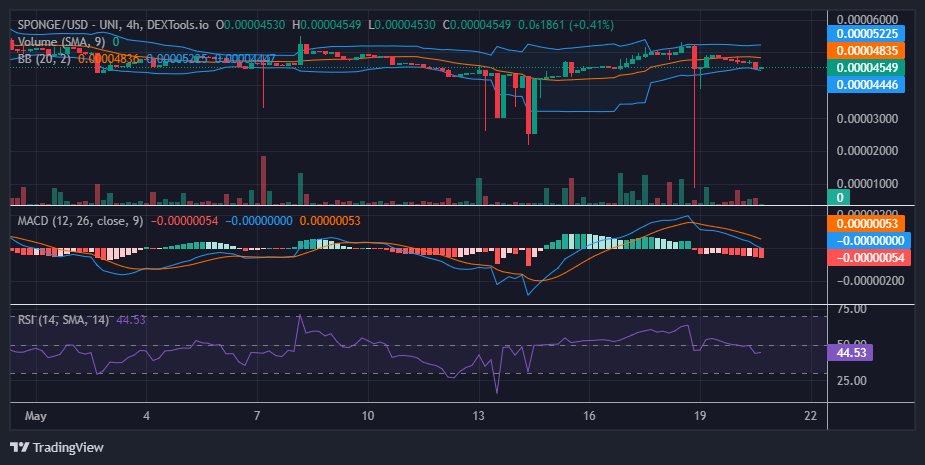
In the latest analysis of the SPONGE/USD market, we observed how bulls quickly responded to the bearish market, which briefly pushed the price deep into bullish territory. Traders capitalized on the dip, driving the price above the $0.00005 level. However, as the bearish pressure strengthened, the price gradually slid to around $0.000045. While bullish sentiment might hold at this level, failure could see the price testing the $0.00004 mark.
Indicators are shifting from bullish to bearish. The lower standard deviation of the Bollinger Bands is trending downward, and the MACD line has crossed below the zero level. Despite these bearish signals, a bounce has been noted at the $0.000045 level.
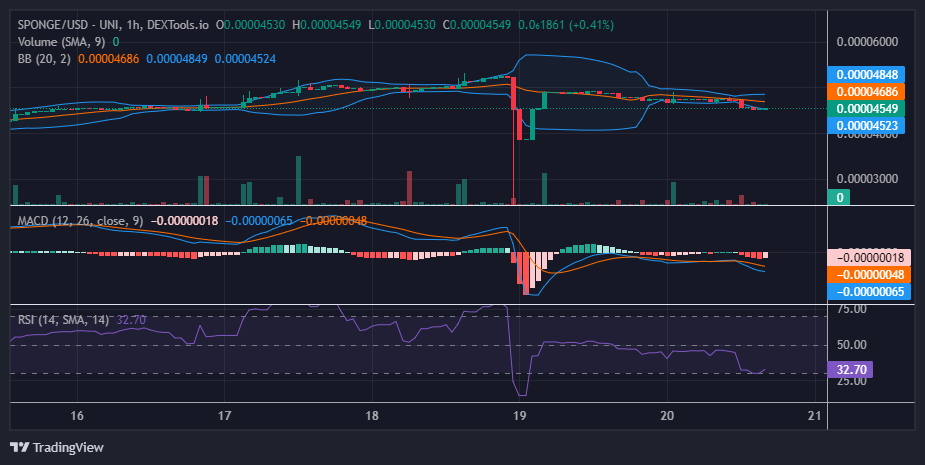
Insights from the 1-Hour Perspective
The short-term outlook suggests that the market may have established a solid support level at $0.000045. For the past two or three sessions, the market has been ranging sideways around this key price level. The Moving Average Convergence and Divergence (MACD) indicator is showing signs of a bullish response, with the last red histogram on the chart appearing in a lighter shade. This crypto signal indicates that the market might be poised for another significant bullish run.
Buy $SPONGE!
King Charles approves 👏 🧽 $SPONGE #SpongeV2 #100x pic.twitter.com/j9Zy4RsJnZ
— $SPONGE (@spongeoneth) May 16, 2024
Invest in the hottest and best meme coin. Buy Sponge ($SPONGE) today!