$SPONGE (SPONGE/USD) Demonstrates Resilience Above $0.00045 Amidst Market Pressures
Estimated Reading Time: 3 minutes
Don’t invest unless you’re prepared to lose all the money you invest. This is a high-risk investment and you are unlikely to be protected if something goes wrong. Take 2 minutes to learn more
In the wake of a robust bull market that propelled SPONGE/USD beyond the pivotal $0.00045 price threshold, the market encountered a series of sell orders, presenting a significant challenge. Navigating through pronounced selling pressure above $0.00045, bullish participants successfully steered the market into a consolidating phase. Despite persistent efforts by bullish traders to regain control, they faced setbacks, leading to the entrapment of bearish sentiment within the ranging market. Current market dynamics hint at the potential emergence of a support level.
Key Price Levels:
- Resistance: $0.00047, $0.00050, and $0.00060.
- Support: $0.000350, $0.00030, and $0.00025.
In-Depth Technical Analysis for $SPONGE (SPONGE/USD) Price Movement:
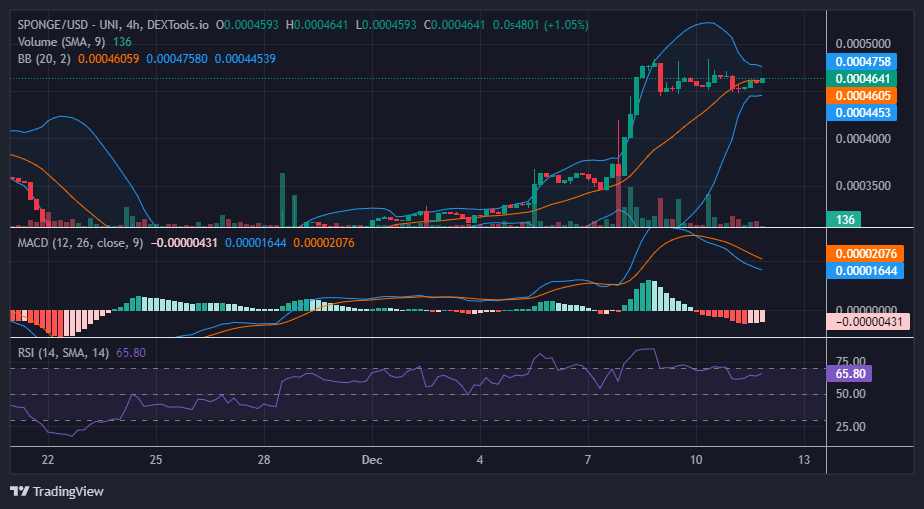
Amidst the sideways consolidation in the $SPONGE market, the Moving Average Convergence and Divergence (MACD) indicator on higher timeframes suggests a possible shift toward an upward trajectory. The diminishing bearish activities within the consolidation, reflected in fading negative histograms, signal weakening bearish sentiment. Additionally, the persistent positioning of MACD lines above the zero level indicates enduring bullish control. This collective evidence implies the potential resurgence of bullish momentum, with the prospect of propelling the market upward from its current position.
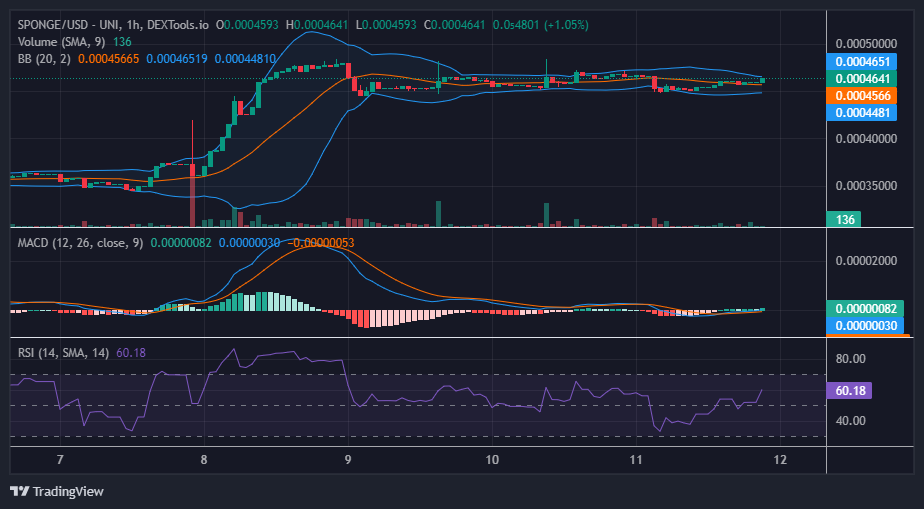
Insights from the Short-Term 1-Hour Chart:
On the 1-hour chart, the Moving Average Convergence and Divergence (MACD) indicator illustrates the convergence of the two lines, accompanied by histograms hovering around the zero level. This pattern suggests a consolidation phase around the $0.00046 level. Simultaneously, the Relative Strength Index (RSI) points towards a potential bullish breakout as the momentum measurement ascends to the 60 level. These combined indicators provide a nuanced perspective, indicating the SPONGE/USD market’s potential readiness for an imminent upward movement in the short term.
Buy $SPONGE!
🚨 Exciting news, #SPONGERS! 🧽
The $SPONGE Airdrop distribution is now complete! https://t.co/iMAdfg9SiS
Check your wallets to see if you’ve made a splash as one of the recipients! 🌊💰#SPONGE #MemeCoin #Airdrop pic.twitter.com/yw7RKVtcg9
— $SPONGE (@spongeoneth) November 7, 2023
Invest in the hottest and best meme coin. Buy Sponge ($SPONGE) today!