$SPONGE (SPONGE/USD): Dip Buyers Eye a Potential Reversal
Estimated Reading Time: 2 minutes
Don’t invest unless you’re prepared to lose all the money you invest. This is a high-risk investment and you are unlikely to be protected if something goes wrong. Take 2 minutes to learn more

The $SPONGE market has witnessed a notable price drop from the $0.0007 region, signaling a surge in bearish volatility. After touching the $0.000013 support area, four consecutive Doji candlesticks appeared — a classic sign that the bearish momentum may be fading and sellers are losing control.
This pattern hints that buyers could be gradually stepping in at this discounted price range, accumulating positions in anticipation of a rebound. Should bullish pressure gain traction, a short-term recovery from the $0.000013 base could soon emerge.
Key Price Levels
-
Resistance: $0.000115, $0.000120, $0.000130
-
Support: $0.000010, $0.000009, $0.000008
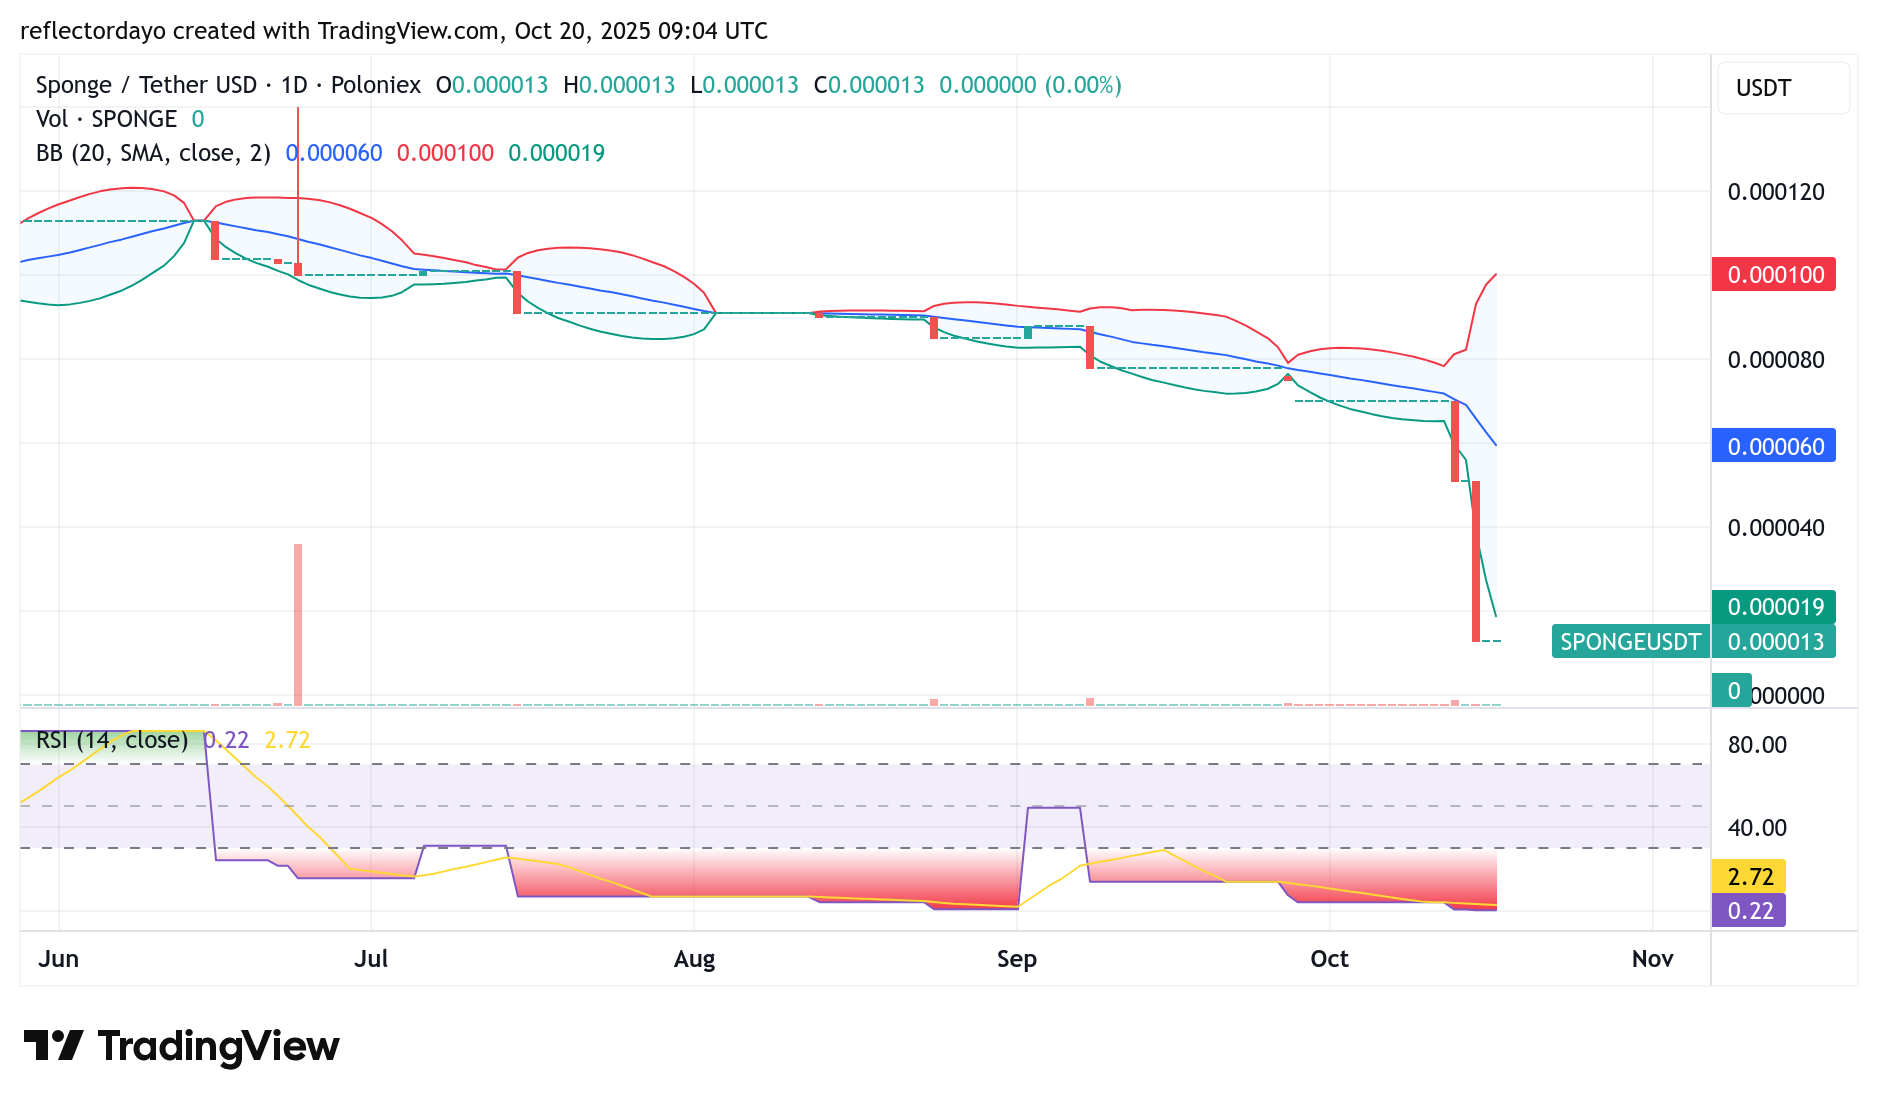
SPONGE/USD Daily Chart – Signs of a Market Reset
The Bollinger Bands show a broad expansion, stretching between $0.0001 and $0.000019 — a reflection of recent extreme volatility. The current price movement below the lower band indicates an oversold condition, suggesting that the crypto signal might be approaching a turning point.
Meanwhile, the Relative Strength Index (RSI) also reinforces this view, hovering deep in oversold territory. With bearish momentum showing signs of exhaustion, $SPONGE may be forming a new foundation for recovery as bargain hunters begin to re-enter the market.
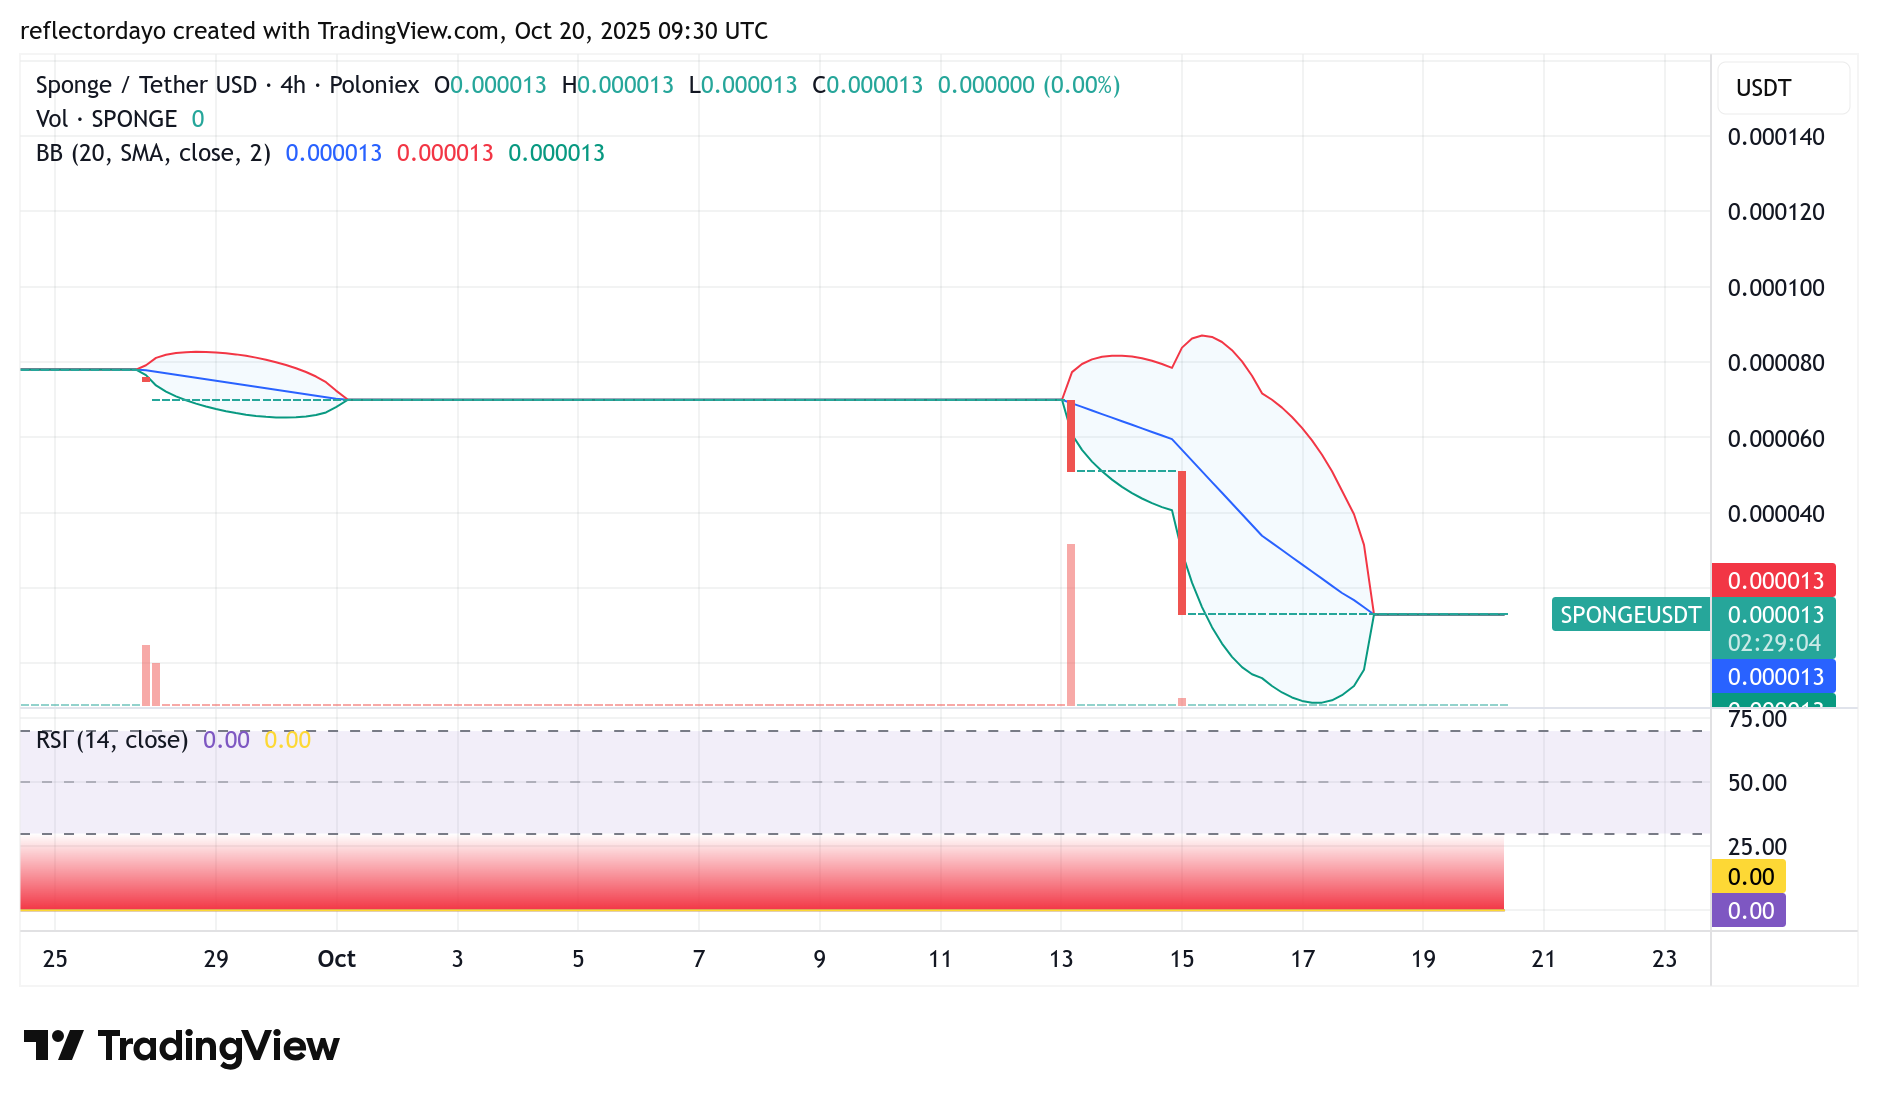
$SPONGE 4-Hour Chart Outlook – Bullish Retaliation Looms
From the shorter-term perspective, SPONGE shows increasing potential for a rebound. If buyers regain control, the next upside target could be near the $0.00006 region. Given the intensity of the preceding selloff, a swift and sharp bullish response may follow once buying pressure builds.
The Bollinger Bands continue to signal high volatility, a condition that often precedes rapid trend reversals. Traders should keep an eye on this setup, as such volatility-driven rebounds can open profitable short-term opportunities.
Buy $SPONGE!
Bears coping hard pic.twitter.com/ITA0Bkj4nj
— $SPONGE (@spongeoneth) October 11, 2025
Join the SPONGE community and get in on the next big crypto opportunity! Buy Sponge ($SPONGE) today