$SPONGE (SPONGE/USD) Faces a Make-or-Break Point at $0.000045
Estimated Reading Time: 2 minutes
Don’t invest unless you’re prepared to lose all the money you invest. This is a high-risk investment and you are unlikely to be protected if something goes wrong. Take 2 minutes to learn more

A recent drop to $0.00003 triggered a fightback from SPONGE bulls, but resistance lurks at $0.000045. This level has become a battleground since April 14th, with neither side gaining dominance. This same struggle was noted in the SPONGE/USD market analysis yesterday, and since then, not much has changed as bulls continue to navigate the possibility of a potential bounce around this level.
Key Market Dynamics:
- Resistance Levels: $0.0010, $0.0011, and $0.0012.
- Support Levels: $0.000035, $0.000030, and $0.000025.
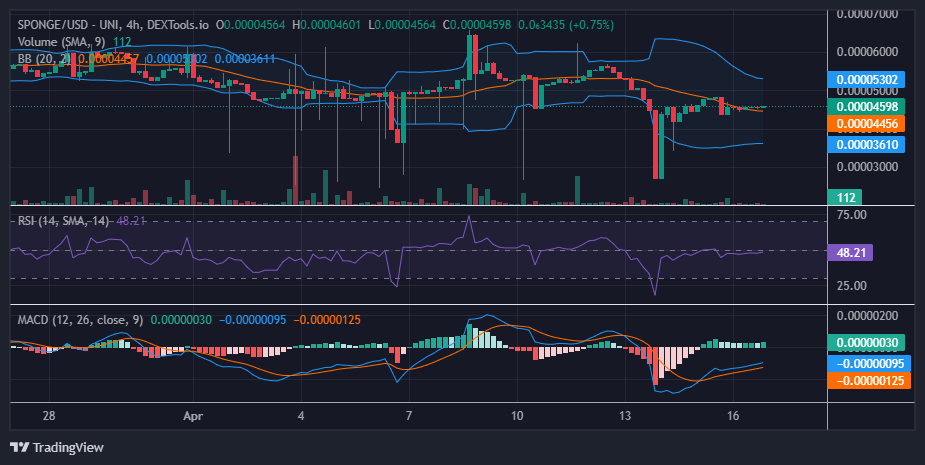
Delving into Technical Analysis for $SPONGE (SPONGE/USD):
Based on the indicators, the SPONGE/USD market seems to remain in a phase of consolidation, lacking a discernible trend direction. The RSI hovering around 48 suggests a balanced market condition, indicative of minimal buying or selling pressure presently. Nevertheless, it’s noteworthy that the Bollinger Bands indicate a diminishing volatility level. Such a crypto signal as this often precedes a potential shift in market momentum towards a clearer direction.
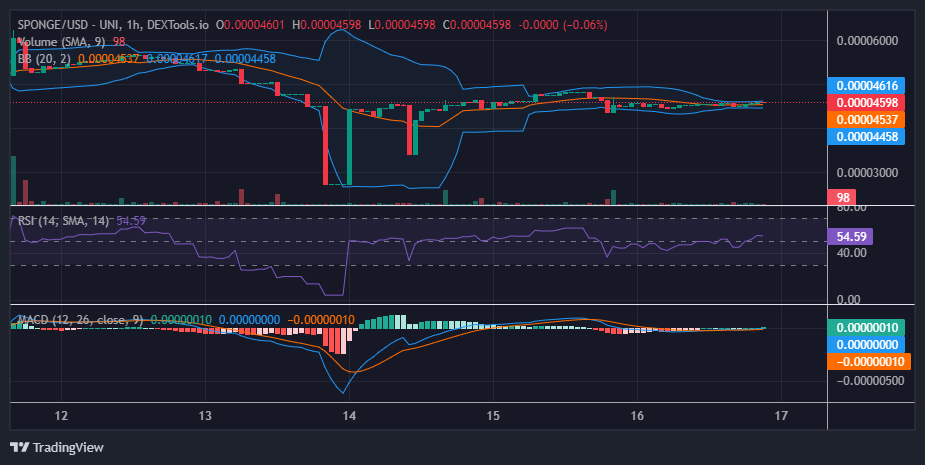
Insights from the 1-Hour Perspective:
The recent price fluctuations between $0.000030 and $0.000045 are apparent in the wide Bollinger Bands on the 1-hour chart. However, a promising sign is the contraction of the bands, suggesting a potential breakout. Reclaiming $0.000045 is pivotal for bulls to reignite their momentum and push towards $0.000050.
Buy SPONGE/USD!
POV: You’re riding $SPONGE to the moon 🚀🔥🌙 #SpongeV2 #AltSeason #memeCoin pic.twitter.com/NcUFIXsUTd
— $SPONGE (@spongeoneth) April 16, 2024
Invest in the hottest and best meme coin. Buy Sponge ($SPONGE) today!